



You know the two mistakes because you have made both. You sold out of your best product a week before a busy stretch and watched buyers go elsewhere. And you have money sitting on a shelf right now in the shape of stock that seemed like a safe bet three months ago and has barely moved since. Neither happened because you were careless. They happened because the reorder decision ran on a mix of last month’s sales, a gut feel about what is coming, and a spreadsheet you update when you remember to.
Demand forecasting software uses past sales data and seasonality patterns to build a statistical model of future demand at the product level. It translates that forecast into reorder thresholds so a business knows when to replenish before stock runs out, replacing reactive spreadsheet-based ordering with a systematic, data-driven approach to purchasing and inventory planning.
The spreadsheet was the right tool for a while. It got you started, it held the whole business in one view, and for a handful of steady products it was honestly enough. This page is about the point where it stops being enough, what a forecasting tool does instead, and how to tell whether you are actually at that point yet.
What does demand forecasting software actually do?
Demand forecasting software takes your sales history and turns it into an estimate of how much of each product you will sell in a future period. That is the whole job. It is not a crystal ball and it does not promise certainty. It replaces a guess with a calculated estimate that you can check, adjust, and act on.
It is worth separating this from sales reporting, because the two get confused. A sales report tells you what already happened: units sold last month, revenue by product, your top sellers. Useful, but backward-looking. A forecast points the other way. It uses that same history to project forward, product by product, so you can decide what to order before the shelf empties rather than after.
The inputs are simpler than the category makes them sound. The core input is past sales, ideally per product and per variation, over a window of time. Better tools let you add seasonality (more on that below) and account for supplier lead time. The output is a forward demand estimate you can read as a number per product, and, when the tool is connected to your stock levels, a signal that tells you when to reorder.
A quantitative forecast is a mathematical model fitted to your sales history. The software looks at a set number of past sales days, finds the pattern in how that product actually sold, and projects that pattern forward. There is no guessing and no black box: it is arithmetic applied consistently, which is exactly what a human doing it by hand cannot keep up with once the product count grows.
How does the forecasting model work?
In plain English, “fitting a model” means the software draws the line that best matches how a product has sold, then extends that line into the near future. The more consistent the sales pattern, the tighter the fit and the more you can trust the number.
The number of past sales days you feed it matters. Too short a window and the forecast overreacts to a single good or bad week. Too long a window and it drags in old behavior that no longer reflects how the product sells today. This is why a configurable history window is a feature worth looking for: a fast-moving consumable and a slow, steady staple do not want the same lookback.
One point worth being blunt about: a good statistical forecast is not AI, and it does not need to be. The math behind demand forecasting has been well understood for decades. When a vendor leans hard on AI language, ask what the model actually does with your data. A transparent quantitative method you can reason about is often more useful to a small operator than a system you cannot question.
How does seasonality factor in?
Seasonal demand is any pattern that repeats on a calendar: sunscreen in summer, candles before the holidays, back-to-school in late August. A forecast that only looks at recent weeks will miss these, because the signal it needs is a year old, not a month old.
Good forecasting tools handle this by letting you point the model at a prior year’s equivalent period. Instead of forecasting this summer from this spring, you forecast this summer from last summer, which is the only fair comparison. That single setting is often the difference between a forecast that is useful for a seasonal catalog and one that is actively misleading.
What if a product has less than a year of history? Then seasonality is a judgment call, not a calculation. A new product cannot be forecast on a season it has never lived through, so you lean on the closest comparable product, a supplier estimate, or a conservative first order, and you let the real data accumulate. Any tool that claims a confident seasonal forecast on three months of data is overselling.
Why does gut-feel reordering fail as you grow?
Gut feel does not fail because operators are bad at their jobs. It fails because the number of things to track outpaces what one person can hold in their head. The cost shows up on both sides of the ledger.
On the stockout side, the losses are larger than the missed sale. Research on shopper behavior found that 43% of consumers go to a competitor when they hit an out-of-stock, and 91% are less likely to shop with that retailer again after the experience. The same research notes the average stockout lasts around 35 days for the affected product, so a single missed reorder is rarely a one-day problem. At the industry level, the combined cost of stockouts and overstock (what analysts call inventory distortion) reached 1.77 trillion US dollars in 2023, with out-of-stocks alone accounting for 1.2 trillion, and inaccurate demand planning named as a primary driver.
On the overstock side, the cost is quieter but just as real: cash tied up in product that is not selling, storage you are paying for, and eventually markdowns or dead stock you write off. Overstock does not trigger an alarm the way a stockout does, which is exactly why it accumulates.
So when does the spreadsheet stop working? The honest signals are practical. You are checking several tabs before you trust a reorder decision. Seasonal products keep catching you off guard. You have more products than you can rank by hand. Or purchasing has quietly become a weekly meeting instead of a data-driven routine. None of these mean the spreadsheet was a mistake. They mean the operation has outgrown what it can keep true.
What is a reorder point, and how does it connect to forecasting?
A reorder point is the stock level at which you should place a replenishment order. Hit it, and it is time to buy more; the goal is that the new stock arrives just as the old runs low.
The forecast is what makes a reorder point accurate. The calculation is straightforward once you have a demand estimate: take the forecasted demand over your supplier’s lead time, then add a buffer called safety stock to absorb the weeks that run hotter than expected. Forecasted daily demand times lead time in days, plus safety stock, gives you the threshold. Without a forecast, the reorder point is a fixed guess that quietly goes stale as demand shifts. With one, it moves as the product’s real demand moves.
This is also where you need to read a vendor’s claims carefully. There is a meaningful difference between software that alerts you when stock falls below the reorder point and software that automatically places the order for you. Most tools aimed at small operators, sensibly, alert rather than auto-order, because a person should still decide quantity, supplier, and timing. An alert removes the risk of forgetting; it does not remove your judgment from the loop. When you evaluate a tool, get clear on which of the two it does before you assume anything.
What features should demand forecasting software have?
For a small business, a short and honest checklist beats a long feature matrix:
- SKU-level forecasting, including variations. A forecast at the category level hides the truth. Two sizes or colors of the same product can sell completely differently, and you order them separately, so you need the forecast at the level you actually buy.
- Seasonality parameters. Look specifically for the ability to base a forecast on a prior year’s equivalent period, not just recent weeks.
- A configurable sales-history window. One fixed lookback for every product is wrong for a mixed catalog. You want to set the window to match how each product behaves.
- A real connection to your stock and purchasing. A forecast that lives in isolation is just a chart. It earns its keep when it feeds reorder points and your purchase orders, so the estimate and the action stay in one place.
- Clarity on alerts versus auto-replenishment. Know which one you are buying, and prefer alerts unless you have a genuine reason to hand off the ordering decision.
- A clean fit with the accounting tool you already use. If you run on Xero or QuickBooks, the forecasting layer should sit alongside them, not force you to abandon your book of record.
How Qoblex handles demand forecasting for small business
Qoblex sits in the operational middle: heavier than a spreadsheet, lighter than an enterprise planning suite. Its forecasting fits that position. Per the Qoblex reporting module, the forecast uses a quantitative technique, a mathematical procedure that looks at a predefined number of past sales days and fits a mathematical model, which is then used to forecast future demand. It is a transparent statistical method, not AI, and Qoblex does not dress it up as one.
The seasonality handling is the practical part. The same reporting module lets you instruct the forecast to compute predictions based on a prior year’s equivalent period, so you can forecast this year’s summer from last year’s summer sales rather than from a season that tells you nothing. The forecast runs per product and per variation, which matches how you actually purchase.
From there it connects to purchasing through reorder points. On the inventory control side, Qoblex raises automatic alerts for products falling below their reorder point, so you get an early warning before stock hits zero. To be exact about scope: the alert informs your purchasing decision; it does not place the purchase order for you. You review the signal and create the order. For businesses that also make what they sell, the forecast and reorder signals feed the same planning picture as Qoblex’s MRP and production planning, so demand and build decisions do not live in separate worlds.
Qoblex is connected to the sales channels you already sell through, and your existing accounting tool stays your book of record. Demand forecasting is a paid capability and is not necessarily part of every plan, so check the current Qoblex pricing for what is included where.
From forecast to reorder: the practical flow
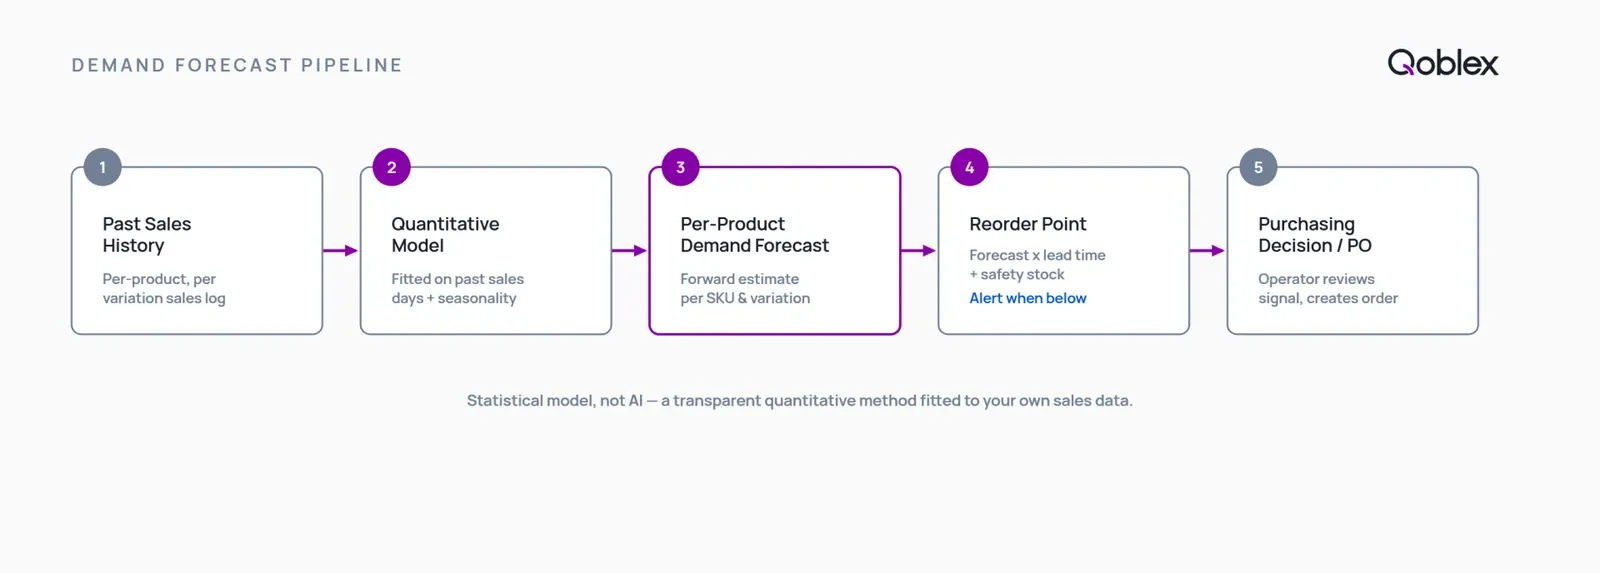
The workflow reads left to right and stays close to how you already work:
- Configure the forecast parameters: the number of past sales days and, if the product is seasonal, the prior-year period to compare against.
- Review the demand forecast per product and variation in the reporting module.
- Set reorder points informed by that forecast and your supplier lead time.
- Receive an automatic reorder-point alert when stock falls below the threshold.
- Create the purchase order based on the alert, keeping quantity and timing under your control.
When you may not need demand forecasting software yet
This is the part most vendors skip, so here it is plainly. A demand forecasting tool is not the right move for every business, and buying one before you need it just adds a setting to maintain.
You probably do not need a forecast model yet if you have a small catalog, roughly under 50 products, with stable, predictable demand and no strong seasonal swings. For that shape of business, simple reorder-point alerts, even ones without a statistical forecast behind them, are usually enough to prevent stockouts. If you can still rank every product by how it sells in your head, and your reorders rarely surprise you, the model is not going to earn its keep.
Where forecasting starts to pay off is when the pattern gets past what a person can track: more products than you can rank by hand, real seasonality, or demand that varies enough between products that one rule no longer fits all of them. The rough tiers below are a self-diagnostic, not a rulebook.
| Situation | Likely right approach |
|---|---|
| Under 50 products, stable demand, predictable reorder | Reorder-point alerts may be enough |
| 50 to 200 products, moderate seasonality, growing channels | Demand forecasting software with a SKU-level model |
| 200+ products, strong seasonality, multi-channel | Statistical forecasting with seasonality parameters, feeding reorder points |
| Enterprise scale, complex network, multiple distribution centers | A full demand planning platform, beyond the middle-ground scope |
If you are not ready yet, the useful next step is not to buy anything. It is to get your reorder points set correctly and your stock data trustworthy first. A forecast built on messy sales history just produces confident-looking wrong answers. Clean data now makes the forecast worth turning on later.
Demand forecasting vs related tools: what is the difference?
The terms overlap in marketing copy, so here is how they actually relate.
Demand forecasting vs inventory management. Inventory management tracks what you have now: stock levels, locations, and movements. Demand forecasting projects what you will need. They are different jobs, and many platforms, Qoblex included, do both, which is why the line blurs. If a tool tracks stock but cannot project demand, it is inventory management, not forecasting.
Demand forecasting vs sales forecasting. Sales forecasting is usually about revenue and is aimed at finance and planning. Demand forecasting is about units per product and is aimed at purchasing and inventory. A revenue forecast will not tell you how many of a specific variation to reorder; a demand forecast will.
Demand forecasting vs replenishment planning. Replenishment is the action, ordering the right amount at the right time. The forecast is the input that makes replenishment accurate. Forecast first, replenish second.
Multichannel demand forecasting is the same idea applied when you sell across several channels at once, where the question becomes how to read demand that is spread across marketplaces and storefronts. That is a distinct problem with its own trade-offs, and it sits alongside the stock-control side of the same situation, multichannel inventory management. One thing worth knowing as context: a channel’s native forecasting tool, such as Amazon’s FBA forecasting, only sees that channel’s own sales and does not read demand from your other channels, which is a real limitation if you sell in more than one place.
FAQ
What is demand forecasting software? Software that uses past sales data and seasonality patterns to build a statistical model of future product demand, translating the output into reorder thresholds and purchasing signals.
How does demand forecasting software work? It fits a mathematical model to a configurable window of historical sales days, optionally using a prior year’s equivalent period for seasonality, and outputs a forward demand estimate per product and variation.
Is demand forecasting software AI? Not always, and it does not need to be. Many tools, including Qoblex, use classical quantitative statistical methods rather than AI or machine learning. Qoblex uses a mathematical model fitted to past sales data, per its reporting module.
What is the difference between demand forecasting and inventory management software? Inventory management tracks current stock levels, locations, and movements. Demand forecasting predicts future demand so you can set the right reorder levels before a stockout. Many platforms include both.
What is a reorder point? The stock level at which a replenishment order should be placed, calculated from forecasted demand over the supplier lead time plus safety stock.
Does demand forecasting software automatically create purchase orders? It depends on the tool. Qoblex triggers automatic reorder-point alerts when stock falls below the threshold; the operator then creates the purchase order.
How much sales history do I need for a reliable demand forecast? At least three to six months of consistent sales data per product. A full year of history is ideal for seasonal products, so the model can use the prior year’s equivalent period as a seasonality input.
When should a small business use demand forecasting software vs a spreadsheet? A spreadsheet works well for fewer than 50 products with stable, predictable demand. Once you have 100+ products, seasonal variation, or multiple sales channels, systematic forecasting significantly reduces the manual effort and the risk of error.