

Gross margin calculator
How to use this calculator
Enter your revenue for a period and the cost of goods sold for the same period. The calculator returns gross margin, markup and gross profit in dollars.
Margin and markup appear together on purpose. They come from the same two numbers and are easy to mix up: a “50% markup” is a 33.3% margin, not 50%.
If cost is higher than revenue, the calculator still shows the negative result. That’s a real answer worth seeing.
Pricing one product forward from its cost, rather than checking margin backward from a sale? The wholesale margin calculator is built for that direction.
Using unit price and unit cost instead of totals
No period totals to hand? Switch “Calculate from” to unit price and unit cost and the formula is the same: (unit price − unit cost) ÷ unit price × 100.
Add units sold if you want the dollar total. A product selling for $50 that cost $30 has a 40% margin and a 66.7% markup whether you sell one unit or ten thousand.
What is gross margin and how do you calculate it?
Gross margin tells you how much of each sale is left once the goods themselves are paid for, before rent, wages and everything else. Nothing further down the income statement can fix a thin one.
The gross margin formula
There are two related figures, and the difference is only the unit:
- Gross profit (dollars) = revenue − cost of goods sold
- Gross margin (percent) = gross profit ÷ revenue × 100
That’s the whole gross profit vs gross margin distinction: an amount, and the same amount as a share of revenue. The formula is only as good as the cost figure you feed it, so it’s worth being clear on what goes into cost of goods sold before you rely on the output.
Worked example, step by step
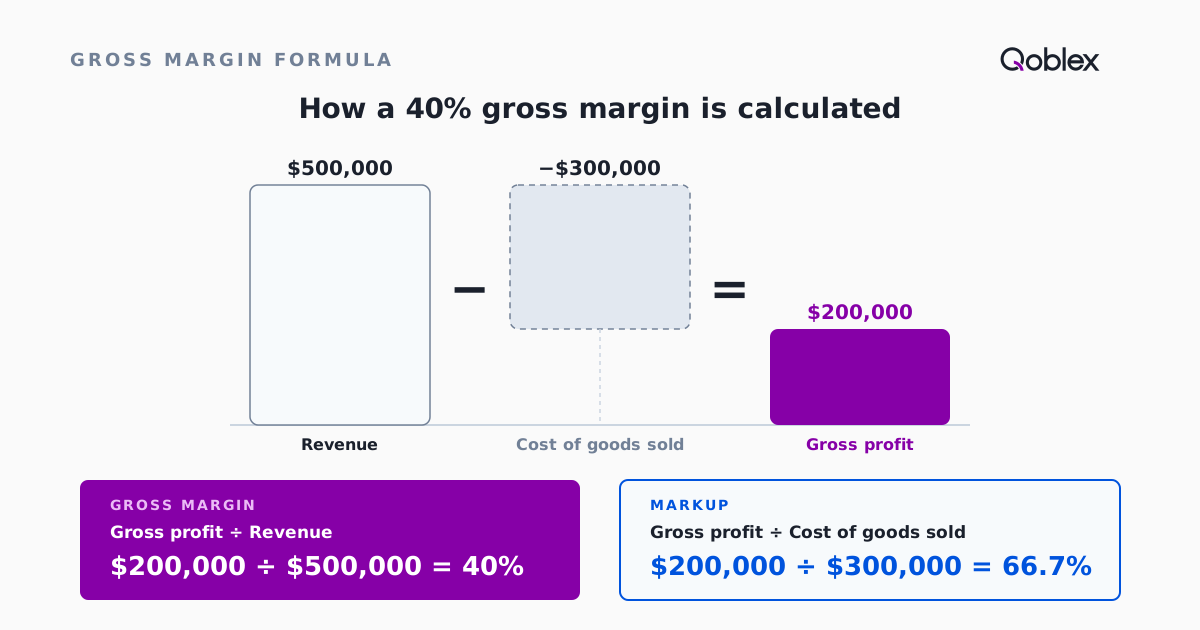
Say a business sold $500,000 of goods last year, and those goods cost $300,000 to buy in.
- Gross profit: $500,000 − $300,000 = $200,000
- Divide by revenue: $200,000 ÷ $500,000 = 0.40
- Multiply by 100: gross margin is 40%
The same numbers give a markup of $200,000 ÷ $300,000 = 66.7%. That’s the example preloaded in the calculator above. If you are setting prices from this, the guide to calculating a selling price covers the steps around it.
Margin vs markup: what’s the difference (and how to convert between them)
Margin divides gross profit by revenue. Markup divides the same gross profit by cost. When you’re making money, cost is smaller than revenue, so markup is always the bigger number.
To convert:
- Markup to margin: margin = markup ÷ (1 + markup)
- Margin to markup: markup = margin ÷ (1 − margin)
| Markup | Gross margin |
|---|---|
| 25% | 20.0% |
| 50% | 33.3% |
| 66.7% | 40.0% |
| 100% | 50.0% |
| 150% | 60.0% |
If your team talks in markup and your accountant reports in margin, this table is where the confusion usually sits. For the markup side in depth, see the complete guide to the markup formula.
What is a good profit margin?
There isn’t one number. A “good” margin depends on which margin you mean, what industry you’re in, and how your business makes money.
Gross margin vs net profit margin
Gross margin only subtracts the cost of goods sold. Net profit margin subtracts every cost of running the business: COGS, operating expenses such as wages and rent, interest and tax. Operating margin sits between them, after operating expenses but before interest and tax. When someone quotes a “good profit margin” for a small business, check which of the three they mean.
Average gross margin by industry
For a sense of range, NYU Stern’s Damodaran dataset, with data as of January 2026, puts the average gross margin across the US companies it covers at 37.76%. By sector:
| Sector | Average gross margin |
|---|---|
| Software (System & Application) | 71.72% |
| Apparel | 56.88% |
| Total market | 37.76% |
| Retail (General) | 33.18% |
| Restaurant/Dining | 32.24% |
| Retail (Grocery and Food) | 26.31% |
The spread is the point. A grocery business at 26% and a software company at 72% can both be healthy. Treat these as industry-wide averages that show the shape of your sector, not a target your own business has to hit.
Why “good” depends on your business model, not one universal number
A high-volume, low-price seller can run a thinner margin because it turns stock quickly. A business holding slow-moving stock needs a wider one to justify the cash tied up. For a small business, the useful comparison is your own history and businesses that sell the way you do, not an industry-wide average. Once you know your margin, the next question is how hard your inventory is working for it, which is what the GMROI calculator measures.
Why your gross margin might be wrong
The calculator can’t tell you whether the cost you typed in is complete. That’s where most margin figures go wrong, whatever you use: Xero, QuickBooks Online and a spreadsheet all report whatever cost figure they’re given.
If your cost of goods sold leaves out freight and duty, your margin is overstated
The supplier invoice goes into cost. The freight bill and customs duty arrive weeks later and get posted as general expenses. The cost is in the books, just not in the COGS your margin used.
As an example: a product sells for $50 and the supplier charged $30, so the margin looks like 40%. If freight and duty add $4 per unit, the real cost is $34 and the real margin is 32%. Across a catalog, that gap decides which products are actually worth reordering. Inbound costs that get goods into your stock are part of their landed cost, and they belong in the unit cost before margin is worked out.
What to check before you trust the number
- Does your unit cost include inbound freight, duty and any handling charges, or only the supplier’s price?
- When purchase prices change, does the cost you use update, or is it last quarter’s figure?
- Is the revenue and the COGS from the same period and the same set of sales?
- Are returns and write-offs landing where your margin can see them?
If any of those answers is “not sure,” the margin is a starting estimate. The inventory costing side of the job is where it gets fixed.
When a quick calculation is enough, and when it is not
A single sale or single product check: the calculator above is enough
Checking one quote, sanity-checking a new product’s price, or explaining margin vs markup to a new hire? You don’t need software for that. The same goes for a small catalog with one supplier and freight that’s already in the price.
Pricing a whole catalog, or a margin that never holds up in the books: incomplete COGS or manual tracking is usually why
It gets harder when you have hundreds of products, purchase prices that drift from order to order, and freight bills that cover a whole shipment. Then the unit cost in your spreadsheet is a snapshot someone has to keep rebuilding, and the margin you calculate on Monday isn’t the margin your accountant sees at month end. The spreadsheet did its job getting you here. The signal to look further is when the numbers need checking by hand before anyone trusts them.
How Qoblex fits in
Qoblex is inventory and operations software that works alongside your accounting platform.
Cost that updates itself, so margin does not go stale
In Qoblex, cost per unit updates when goods are received, not in a month-end batch or a spreadsheet formula somebody maintains. Moving average cost is the default, so each new purchase at a new price moves the cost as soon as the receipt is recorded, and every sale after that reads the new figure.
Freight and duty rolled into the cost before margin sees it
Freight, duty and other charges go on the purchase order, and Qoblex allocates them across the line items with each line taking a share in proportion to its own net value. The result rolls into unit cost as goods are received, so your margin already includes it. Approved purchase orders sync to Xero or QuickBooks Online, which stay your book of record. Each accounting connection is a paid integration; see pricing for current details.
Margin by product, on demand
The Sales by Product report gives volume, value, cost of goods sold, order count and margin for each product over a period you choose. Think of it as the calculator above run across your whole catalog. Your best seller and your best earner are often different products, and this is where that shows up.
If one product at a time is all you need, keep using the calculator.
FAQ
What is the gross margin formula?
Gross margin % = (revenue − cost of goods sold) ÷ revenue × 100. Gross profit is the dollar amount; gross margin is that amount as a percentage of revenue.
What is a good gross margin percentage?
It depends on industry. NYU Stern’s Damodaran dataset (January 2026) shows averages from 26.31% in grocery and food retail to 71.72% in software, and 37.76% across the whole market.
Is gross margin the same as markup?
No. Margin divides gross profit by revenue; markup divides it by cost. They describe the same dollars two ways and are never equal above zero. A 50% markup is a 33.3% margin, not 50%.
What is the difference between gross margin and net profit margin?
Gross margin subtracts only the cost of goods sold from revenue. Net profit margin subtracts every cost of running the business, including operating expenses, interest and tax, so it is always the same as or lower than gross margin for the same period.
Does cost of goods sold include shipping and duty?
It should include inbound freight and duty that are directly tied to getting the goods you sold into stock, which together make up their landed cost. Posting them as general expenses instead overstates gross margin. Your accountant can confirm how your own accounts treat them.
How do I calculate gross margin from unit price and unit cost instead of totals?
Gross margin % = (unit price − unit cost) ÷ unit price × 100. The calculator above supports both.