


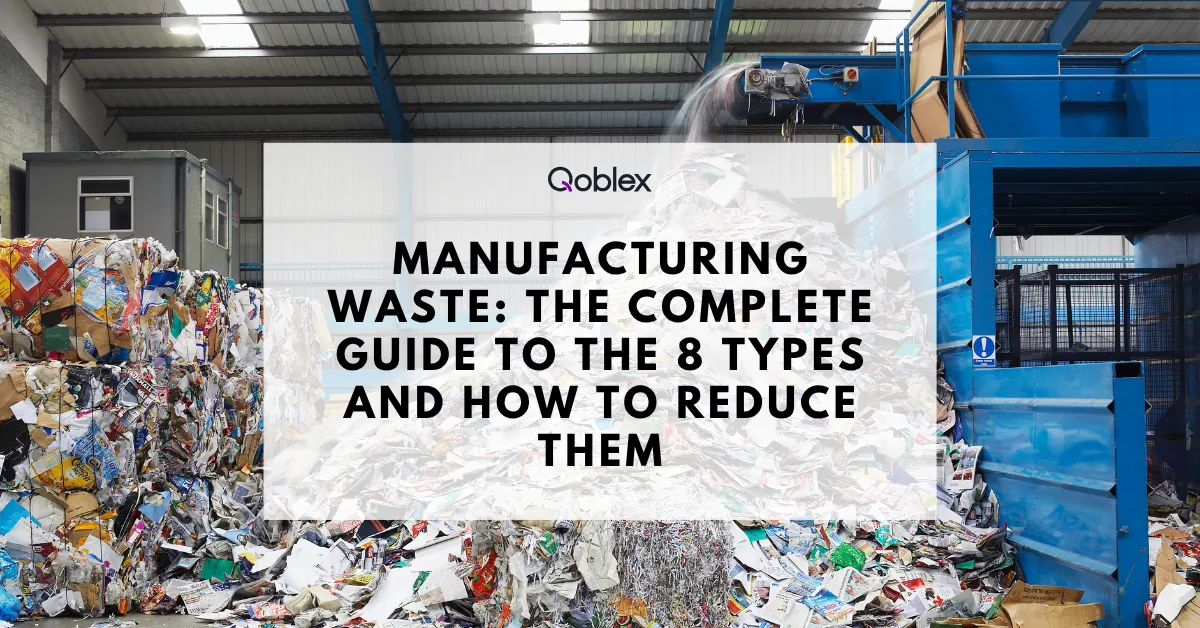
Every factory generates it. Every CFO quietly hates it. And every operations manager wishes they had an extra hour to fight it. Manufacturing waste is the silent tax on margins — a mix of scrapped products, idle equipment, excess stock and underused talent that drains cash before it ever reaches the bottom line.
Globally, the totals are staggering. Industry estimates put factory-floor losses at around $8 trillion per year. In the United States alone, EPA Toxics Release Inventory data shows the manufacturing sectors managed billions of pounds of chemical waste in 2023, a 3.5 billion pound jump (+13%) over 2022, driven largely by recycling gains at soybean processing facilities. Only 4% of that total was released into the environment — the rest went through treatment, energy recovery, and recycling.
Pollution prevention is now a board-level priority, not a back-office chore. That progress didn’t happen by accident. It’s the result of a lean mindset that treats every unnecessary step and every extra raw material as a loss worth eliminating. This guide explains what manufacturing waste really is, the 8 categories used to classify it, the physical and environmental streams alongside, and 12 strategies — including the role of inventory management software — that help companies reduce losses and reclaim margin.
What is manufacturing waste?
Manufacturing waste is any material, resource, activity or duration expended during production that does not transform raw materials into something a customer is willing to pay for. In lean thinking, waste is any step the customer does not want to fund.
The definition covers more than scrap metal:
- Physical waste — scrap, defective units, packaging residue, hazardous byproducts, wastewater and pollution from emissions.
- Process waste — unnecessary motion, excessive transportation, overprocessing, overproduction, idle waiting.
- Resource waste — excess stock, underused equipment, energy consumed during idle runs, water used beyond strict need.
- Human waste — underutilized talent, ignored employee ideas, skills left undeveloped.
Two things make this challenge dangerous. First, much of it is invisible: a work order sitting 36 hours in a queue looks harmless, yet the carrying cost is real. Second, losses compound — an inaccurate stock count triggers overproduction, which creates excess stock, which hides defects, which eventually creates customer complaints. Tackle one type and several others fall with it.
Why reducing manufacturing waste matters
Reduction has always been a cost story. Today it’s also a growth story, a risk story, and an environmental story.
Margin. Loss reduction flows straight to gross margin. A single lean project at one utility removed just four minutes of transportation per unit and saved more than $40,000 per year. Small gains multiplied by volume add up fast. Cutting even 2–3% of factory-floor losses can match a price increase — without touching the customer.
Cashflow. Expansion is the riskiest moment in a manufacturer’s life. Many companies never survive the transition from small to mid-sized because working capital balloons: additional stock, additional WIP, additional receivables. Pull-based production protects cashflow during scaling by keeping working capital low.
Environment. Regulators, customers and investors now expect transparency on emissions and resource use. Facilities that reduce losses also reduce their carbon footprint, their water use, and their exposure to pollution-related fines. EPA data shows manufacturing sector air releases fell 105 million pounds between 2014 and 2023 — a 15% drop — even as the sector’s value added grew by 13%.
Talent. A well-run operation is also a better place to work. If employees see their ideas implemented and their skills developed, engagement and retention improve. In a market where skilled operators are scarce, that matters.
The 8 types of manufacturing waste (TIMWOODS)
The lean manufacturing framework recognizes 8 categories, remembered by the acronym TIMWOODS (or the newer mnemonic DOWNTIME). Taiichi Ohno identified seven at Toyota as part of the Toyota Production System, and when each category is addressed systematically, real savings follow. The 8th — non-utilized talent — was added in the 1990s as continuous improvement spread to Western factories.
1. Defects
Defects are products or outputs that fail quality standards and must be reworked or scrapped. Such failures drain raw materials, direct labor, machine hours and customer trust.
Causes include weak quality control, poor training, faulty equipment and unclear specifications. Document-level errors often start the chain — a missing PO number, wrong figures on a spreadsheet, an incomplete work order each trigger physical problems downstream.
Countermeasures: quality checks at every step, preventative maintenance, standardized work, clear BOMs, and error-proofing (poka-yoke).
2. Overproduction
Overproduction happens as a line builds greater quantities than the next downstream step or the customer actually needs. It is often called the worst category because it triggers the others — excess stock, extra motion, extra transportation, idle spells, and hidden quality problems.
Imagine baking a dozen pies for a party of five: ingredients, oven hours and storage are paid for, and most of the output spoils. The counter-philosophy is Just-in-Time (JIT) — bake fresh pies exactly as guests arrive.
Countermeasures: pull systems such as Kanban, Takt Time to balance stations, smaller batch sizes, and accurate demand forecasting.
3. Waiting
Any idle interval for people, materials or machines. An operator without parts, a paused machine during changeover, a purchase order stuck in approval — all examples. The effect is particularly corrosive because it disrupts flow and directly extends lead time.
Countermeasures: synchronize steps, level the workload, maintain reliable equipment, cross-train operators, and keep materials staged at the point of use.
4. Non-utilized talent
The 8th category is not about machines or materials — it is about people. Every employee idea that is never asked for, every skill left undeveloped, every operator treated as a pair of hands rather than a problem-solver is a loss.
It is like owning a gold mine and choosing to dig for coal. Frontline workers see problems first; without leadership engagement, improvement stalls.
Countermeasures: regular training, structured suggestion systems, kaizen events, and genuine authority for teams to change their own processes.
5. Transportation
Unnecessary movement of materials, components and finished goods around the plant. Every extra meter travelled adds handling labor, damage risk, energy cost, and lift-truck hours.
Countermeasures: redesign the plant layout so steps sit next to each other, adopt a U-shape production line, use value stream mapping to see the full flow, and push cross-docking for finished goods where it fits.
6. Inventory
Stock beyond the level required to sustain steady flow is waste: it consumes capital, floor space and risk. Raw materials, work-in-progress and finished goods all qualify.
The category is not only physical. Backlogged invoices, unanswered sales calls, unread reports and obsolete records in a database are all queued-up loads that slow a business down.
Countermeasures: reorder points tied to takt, defined minimum and maximum levels, JIT replenishment, and forecasts built on real sales data.
7. Motion
Needless movement of people or equipment — reaching, walking, bending, searching, double-keying data. It costs money through fatigue, injuries and non-value-added labor hours.
Countermeasures: ergonomic workstation design, 5S organization, placing tools within arm’s reach, and workflow mapping at the task level.
8. Extra processing
Overprocessing means doing more than the customer requires — using a high-precision laser cutter to slice bread, adding features nobody asked for, generating reports nobody reads, or requiring three signatures where one would do.
Countermeasures: process mapping to strip non-value-added steps, tight customer requirements definition, and honest review of approvals and reports.
Physical and environmental waste
The 8 categories focus on process inefficiency. Alongside them, every factory also generates physical and environmental waste that regulators care about:
- Hazardous and chemical waste — solvents, cutting fluids, plating chemicals. EPA reporting shows manufacturers recycled a dramatic uptick of additional chemical material in 2023 — most of it recovered rather than released.
- Wastewater and industrial sludges — often the dominant stream for process manufacturers. Reducing water use through closed-loop systems and leak detection is a direct cost saver.
- Packaging — single-use dunnage, corrugated, plastic film. Redesigned packaging and bulk shipping cut disposal cost and environmental footprint.
- Energy — idle equipment, compressed-air leaks, inefficient lighting, oversized motors running at low load.
- Obsolete and expired stock — expired materials, changed formulations, and unsellable finished goods all become disposal problems and pollution contributors.
Treating these under the same elimination umbrella ensures your program does not stop at the factory door.
How to identify waste in your factory
Identification comes before elimination. Several complementary techniques exist:
Gemba walks and waste walks. Walk the floor end-to-end with a checklist of the 8 categories. At each station, note what’s visible: stacks of WIP, idle operators, tools fetched from far away, defective parts in a bin. Small teams running a one-hour walk weekly surface dozens of opportunities.
Value Stream Mapping (VSM). VSM is the management tool for analyzing the current state of a product family and designing its future state. Information and material flow are drawn side by side, value-added duration is separated from non-value-added duration, and idle buffers become visually obvious.
Data-driven identification. Modern factories instrument the shop floor with sensors, MES and ERP data to measure OEE (Overall Equipment Effectiveness), scrap rate, first-pass yield and inventory turnover. If a machine consistently shows low availability, idle loss is the issue. If scrap climbs, defects are the target.
Four-principle framework. Many teams tie identification to action through the four principles: pull (customer demand pulls effort through the system), one-piece flow (minimize WIP), takt (manufacture at the pace of demand), and zero defects (never pass a faulty unit forward). Each category maps cleanly to at least one principle, making fixes easier to design.
12 proven strategies to reduce manufacturing waste
Spotting losses is only useful if a team also eliminates them. These levers cover the big ones:
- Implement efficient inventory management. Obsolete, damaged or overstocked materials are the single largest contributor. JIT ordering, accurate reorder points, and real-time stock visibility cut the root cause.
- Run regular audits. A quarterly audit of equipment usage, scrap bins, changeover metrics and downtime data surfaces the top three opportunities.
- Plan around real demand. Use demand forecasting tied to actual sales signals, not gut feel. Align schedules with confirmed orders and resist the temptation to “fill the plant.”
- Shorten lead times. Investments in IT infrastructure, digital work instructions, and supplier integration reduce the span between order and shipment.
- Rethink packaging. Use minimum dunnage, replace single-use films with reusable or recyclable alternatives, and negotiate bulk deliveries.
- Practice volume reduction. Compaction, dehydration, and source segregation cut disposal volume and cost, and often increase reusability.
- Recover, reuse, and sort. Use green manufacturing techniques. Implement a clear sorting system on the shop floor. Explore waste exchange programs with neighboring facilities.
- Establish preventative maintenance. Unplanned downtime is pure idle loss and often creates quality failures. A proactive plan keeps equipment healthy.
- Organize the warehouse. A 5S-organized warehouse cuts motion, transportation and idle loss simultaneously.
- Adopt closed-loop production. Track materials and byproducts, feed recycled material back in, and design products for disassembly so customers can recycle at end of life.
- Cut water and energy. Audit water-intensive processes for leaks. Recover heat. Shut down compressed-air leaks — silent cash drains that also feed pollution.
- Train every employee. Your team is only as strong as its weakest member. Train frontline workers to spot losses, give them channels to propose fixes, and recognize them if ideas land.
The role of inventory management software in reducing waste
Three of the eight categories — overproduction, excess stock and idle waiting — all trace back to poor data. If the system says 200 units but the shelf holds 147, planners compensate with extra orders, expediting, and safety buffers that become dead stock. If demand signals arrive late or inaccurately, production plans swing between shortages and surpluses.
Modern inventory management software closes that gap. It gives manufacturers real-time visibility across multi-warehouse operations, connects sales channels to production planning, and turns demand forecasting from a spreadsheet guessing game into a data-driven recommendation engine. Direct impact on waste management includes:
- Fewer overproduction losses — orders flow into production in the right batch sizes, at the right moment.
- Lower carrying cost — stock levels match real demand, not fear.
- Less idle waste — raw materials and components are available as the line needs them.
- Fewer stockout-driven quality failures — operators are not forced to substitute.
- Less motion and transportation — accurate bin locations mean pickers walk the right aisle first.
Qoblex is built for exactly this challenge. Designed for growing manufacturers, wholesalers, brick-and-mortar retailers and eCommerce brands, it centralizes stock across warehouses, connects to the sales channels companies already use (Shopify, WooCommerce, Amazon,or Brick & Mortar stores) and gives planners the real-time signal needed to stop overproducing and start producing to pull. Customers manage more than $3.7 billion in goods annually through the platform.
If lean-driven loss reduction is on the roadmap, the inventory layer is where the biggest, fastest wins live.
KPIs for waste reduction
You cannot improve what you don’t measure. These are the KPIs to track monthly — with the category each one surfaces:
- OEE — availability × performance × quality. Surfaces idle loss, quality failures and overprocessing in one number.
- Scrap rate (%) — direct view of quality waste.
- First-pass yield (FPY) — percentage of units produced correctly on the first attempt.
- Inventory turnover — cost of goods sold ÷ average stock. Rising turnover means less holding waste.
- Days inventory outstanding (DIO) — average days materials sit on shelves. Shorter is leaner.
- On-time delivery (OTD) — surfaces idle loss and overproduction mismatches.
- Lead time (order to shipment) — the best summary metric.
- Cost of poor quality (COPQ) — combined cost of rework, scrap and warranty claims.
- Energy and water per unit — operational KPIs that double as sustainability measures.
Set a baseline, publish the dashboard where operators can see it, and review it in a short daily or weekly standup.
Frequently asked questions
What is the definition of manufacturing waste?
Factory-floor waste is any material, resource, activity or duration consumed during production that does not add value from the customer’s point of view. In lean terms, the definition includes anything the customer is not willing to pay for — scrap, excess stock, idle equipment, or untapped employee skills.
What are the 7 wastes of manufacturing?
The original 7 wastes, identified by Taiichi Ohno at Toyota, include Transportation, Stock, Motion, Waiting, Overproduction, Overprocessing and Defects — often remembered as TIMWOOD.
What are the 8 manufacturing wastes?
The 8 categories add a “skills” dimension to Ohno’s original seven: Transportation, Stock, Motion, Waiting, Overproduction, Overprocessing, Defects, and Non-utilized talent (Skills). The full acronym is TIMWOODS; the modern mnemonic DOWNTIME covers the same eight.
What are two types of waste in manufacturing?
Two broad groups cover most shop-floor situations: process waste (overproduction, idle spells, motion, transportation, overprocessing) and resource waste (quality failures, excess stock, non-utilized talent). Physical and environmental streams — chemical waste, wastewater, packaging — sit alongside and are usually tracked separately for compliance.
Conclusion: building a zero-waste mindset
Factory-floor waste will never reach zero — every process generates some byproduct, and every forecast is imperfect. But the gap between “we know we have losses somewhere” and “we can point to the top three sources and show last month’s reduction” is the difference between surviving and scaling.
The playbook is clear. Start with a walk. Map the value stream of your top product family. Pick two categories where the numbers hurt most — usually stock and overproduction. Put the right inventory management software behind the team so data stops being the bottleneck. Measure OEE, scrap rate, and stock turnover. Celebrate small wins, because the $40,000 transportation saving at one plant began with four minutes.
Reducing losses is how good factories become great ones — leaner, more profitable, more sustainable, and far more engaging to work in. Start today: one audit, one KPI, one fix at a moment.
| Waste | Typical cause | Primary countermeasure | KPI to watch |
|---|---|---|---|
| Defects | Weak quality control, unclear specs | Poka-yoke, standardized work, PM | Scrap rate, FPY, COPQ |
| Overproduction | Push planning, weak demand signal | Pull / Kanban, smaller batches, JIT | DIO, OTD |
| Waiting | Line imbalance, unplanned downtime | Takt balancing, PM, cross-training | OEE availability |
| Non-utilized talent | Top-down culture, no suggestion system | Kaizen events, structured feedback | Ideas / employee / month |
| Transportation | Poor plant layout, far-apart steps | U-shape flow, VSM, cross-docking | Meters / unit, handling cost |
| Inventory | Over-ordering, weak forecast | JIT, reorder points, real-time stock | Inventory turnover, DIO |
| Motion | Poor workstation layout, missing tools | 5S, ergonomic design | Labor hours / unit |
| Extra processing | Over-spec’d process, excess approvals | Process mapping, customer voice | Cycle time / unit |
60-minute waste-walk checklist
Print this and bring it to the floor. Tick what you observe at each workstation — you’ll surface more opportunities in one hour than most teams find in a quarter.
- ☐ Stacks of WIP between stations (inventory / overproduction)
- ☐ Operator waiting for parts or instructions (waiting)
- ☐ Tools fetched from more than 2 meters away (motion)
- ☐ Forklifts travelling long distances repeatedly (transportation)
- ☐ Scrap bin visibly full or overflowing (defects)
- ☐ Machine producing while next step is idle (overproduction)
- ☐ Double-entry of data or paper rework (extra processing)
- ☐ Suggestion board empty or out of date (non-utilized talent)
- ☐ Compressed-air leaks audible (energy waste)
- ☐ Leaking taps or unused water running (water waste)