



Imagine your warehouse overflows with products gathering dust. Your team spends countless hours managing inventory that barely contributes to revenue. Profit margins shrink under the weight of excess complexity. This costly scenario plays out across industries daily.
SKU rationalization solves this problem directly. This strategic process identifies and eliminates underperforming products, freeing resources for your best sellers. Companies executing this well report inventory cost reductions of 15-30% and improved cash flow within months. If you are a supply chain, operations, or ecommerce manager wrestling with product portfolio bloat, this guide provides the systematic framework you need to rationalize SKUs, reclaim profitability, and streamline operations.
We will cover what SKU rationalization is, why it matters, how to implement it systematically, the metrics that drive decisions, and critical mistakes to avoid. By the end, you will have an actionable roadmap for your organization.
What is SKU Rationalization?
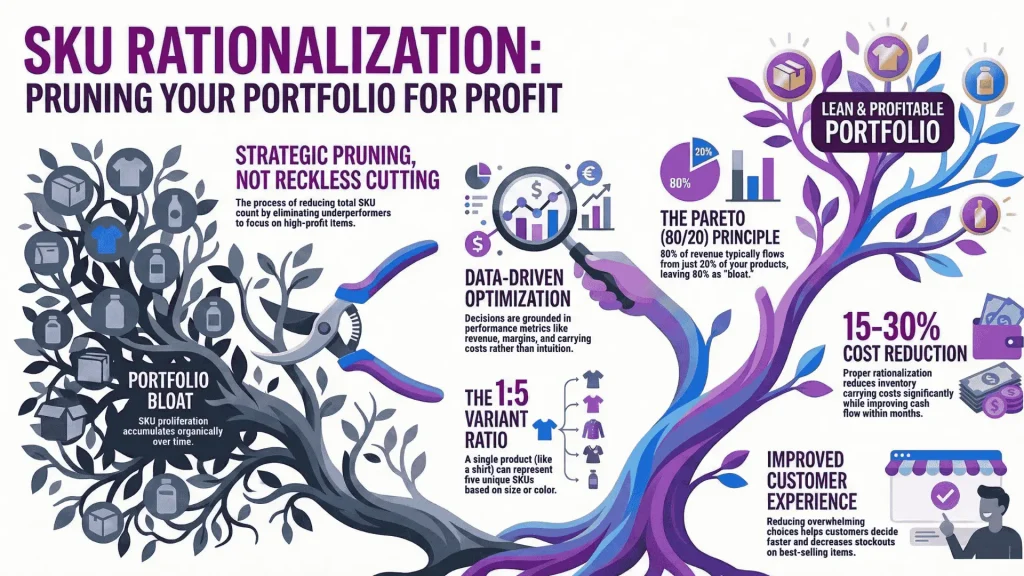
SKU Definition: A stockkeeping unit (SKU) is a unique identifier assigned to each distinct product variant you stock and sell. A single product, such as a blue t-shirt, might have five SKUs for different sizes. SKU rationalization is the strategic process of reducing your total SKU count by eliminating underperformers, focusing your portfolio on products that drive profit and customer satisfaction.
SKU rationalization is not reckless product cutting. It is data-driven inventory optimization grounded in performance metrics. You analyze which products drive revenue, which drain resources, and which could be bundled or repositioned. The goal: keep only SKUs that justify their inventory carrying costs and contribute meaningfully to profit.
Why Every Business Accumulates Too Many SKUs
Most companies grow their SKU counts organically without deliberate pruning. New products launch to test markets. Seasonal items remain in systems indefinitely. Sales teams push for variety to win deals. Suppliers introduce new options continuously. Within years, you are managing 50% more SKUs than actually generate meaningful revenue.
The Pareto principle applies here with striking clarity: typically, 80% of your revenue comes from just 20% of your SKUs. The remaining 80% of product variants consume disproportionate resources while contributing minimal profit. This inefficiency compounds across warehousing, labor, technology systems, and working capital tied up in excess inventory.
The Hidden Cost of SKU Proliferation
Inventory carrying costs rise with each new SKU. These include storage space, handling labor, insurance, obsolescence risk, shrinkage, and capital costs. A single slow-moving SKU might cost $500-$1,000 annually to maintain in your system.
Dead stock and slow-moving inventory represent trapped cash that generates zero revenue while accumulating carrying costs. When SKU counts balloon beyond 500-1,000 items, identifying and removing these resource drains becomes nearly impossible without systematic analysis. Supply chain efficiency suffers as complexity increases exponentially.
Why SKU Rationalization Matters: The Business Case
Strategic SKU rationalization delivers measurable financial and operational benefits. Understanding these drivers helps you justify the initiative to stakeholders and maintain momentum during implementation.
Reduce Inventory Carrying Costs Substantially
Inventory carrying costs typically run 20-30% of product value annually. This encompasses storage space, labor, insurance, obsolescence, shrinkage, and capital costs. Rationalized portfolios directly reduce these expenses.
Consider a concrete example: eliminating 100 underperforming SKUs might reduce carrying costs by $200,000 annually. That capital flows directly to your bottom line with no revenue reduction if you have selected the right products to discontinue.
Improve Profit Margins Through SKU Management
Working capital trapped in excess inventory damages cash flow significantly. Rationalization frees capital previously sitting idle in warehouses. This capital becomes available for high-performing products, marketing initiatives, or growth investments.
Reduced complexity improves margins substantially. You negotiate better pricing with suppliers when purchasing higher volumes of fewer items. Labor efficiency increases when your team manages fewer marginal SKUs. Many companies report 2-5% margin improvement after rationalization, driven by volume discounts and operational efficiency gains.
Streamline Operations and Supply Chain Efficiency
Every SKU adds complexity to your supply chain. More SKUs mean more purchase orders, supplier relationships, quality control checkpoints, inventory locations, and picking-packing operations. Rationalization removes unnecessary complexity systematically.
Your demand forecasting becomes significantly more accurate with fewer, better-performing SKUs. Procurement teams spend less time managing multiple variants within single categories. Warehouse layouts become more efficient. Fewer SKUs reduce stockout risk on bestsellers, since teams focus demand planning on products that genuinely matter.
Enhance Customer Experience Through Choice Optimization
Paradoxically, offering fewer choices often improves customer satisfaction significantly. Research on the paradox of choice demonstrates that too many options overwhelm customers, making decisions harder and satisfaction lower. By keeping best-performing products and eliminating weak performers, you enhance the shopping experience measurably.
Customers find what they need faster with simplified selection. Inventory accuracy improves because you are managing fewer variants. Backorders and stockouts decrease on bestsellers. The result: improved customer satisfaction, higher conversion rates, and better lifetime value for your ecommerce inventory management.
How to Rationalize SKUs: A Proven 5-Step Process
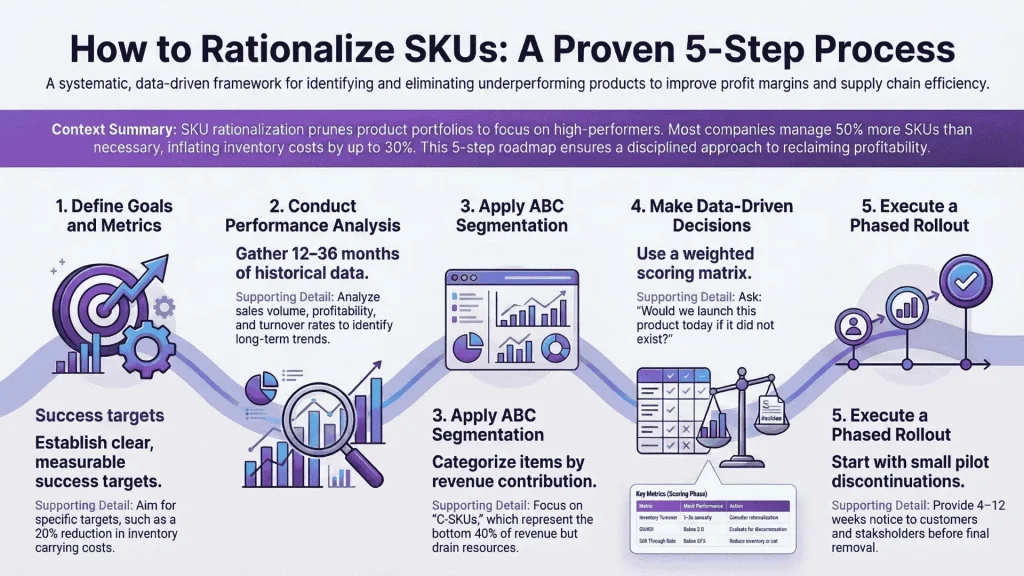
Systematic rationalization requires discipline, data, and structured methodology. This five-step framework guides implementation without cutting too aggressively or missing critical insights.
Step 1: Define Goals and Success Metrics
Start by clarifying what you want to achieve. Target a specific inventory cost reduction percentage? Improve cash flow by a defined amount? Achieve faster inventory turnover rates?
Write your goals in measurable terms. Example: “Reduce inventory carrying costs by 20% while maintaining at least 95% of current revenue.” This acknowledges acceptable revenue loss when it drives significant cost savings.
Define success metrics upfront. Track inventory turnover ratio, carrying cost per SKU, days inventory outstanding, and gross margin. Establish baseline measurements before rationalization begins. This makes measuring impact and justifying effort to leadership straightforward.
Pro Tip: Set conservative initial targets. Start with 10-15% SKU reduction from your underperforming segment. Measure results thoroughly. Rationalize further if outcomes support scaling the initiative.
Step 2: Conduct Comprehensive SKU Performance Analysis
Gather data on every SKU systematically. You need sales volume (units and revenue), profitability by SKU, current inventory levels, sell-through rate, backorder frequency, return rates, and age of inventory. Most systems can extract this from your ERP or inventory management platform.
Include data spanning multiple periods when possible. Twelve months reveals seasonal patterns. Two to three years of history identifies truly slow-moving items versus temporary slumps. Flag any data quality issues before proceeding further.
Segment your SKU performance analysis by customer segment if available. A product might be a bestseller for one customer group but a slow-mover for another. This nuance significantly impacts decision-making accuracy.
Step 3: Apply ABC Analysis and Performance Frameworks
ABC inventory analysis is the standard framework for SKU rationalization. Categorize each SKU as A, B, or C based on revenue contribution and profit impact.
A-SKUs represent approximately 20% of inventory count but generate 80% of revenue and profit. These are your stars. Protect them fiercely. Ensure adequate inventory levels and minimal stockouts on bestsellers.
B-SKUs are middle performers. They contribute meaningful revenue but represent disproportionate inventory management costs. These warrant closer scrutiny. Some B-SKUs deserve rationalization; others are strategically important and should be protected.
C-SKUs represent the bottom 30-40% of revenue contribution but consume significant management effort. These are candidates for elimination, bundling, or discontinuation. Most companies do not make deliberate decisions about C-SKUs, and that is where waste accumulates heavily.
Beyond ABC analysis, apply additional SKU performance metrics: profitability analysis, inventory turnover rates, sell-through rates, and GMROI. A high-revenue SKU might show low profitability. Another might turn quickly but barely cover carrying costs. Multiple frameworks build a complete picture.
Step 4: Make Data-Driven Discontinuation Decisions
This is where hard decisions happen. Use a scoring matrix weighting multiple factors: revenue contribution, profit margin, inventory turnover, sell-through rate, backorder rate, and strategic importance.
For each SKU, ask: Would we launch this product today if it did not exist? An honest “no” indicates a rationalization candidate. Consider bundling strategies before discontinuation. A slow-moving item might pair well with a bestseller, creating cross-sell opportunities that revive underperforming SKUs.
Document your reasoning for every decision thoroughly. You will face pushback from sales teams who love variety and manufacturing who worry about setup costs. Data-driven justification, not gut feeling, strengthens your position significantly.
Account for seasonal products explicitly. Discontinuing all winter items in July creates future problems. Keep seasonal SKUs but track them separately. Plan rationalization with the full calendar in mind.
Step 5: Implement Changes with Phased Approach
Implementation is where many SKU rationalization initiatives stumble. Removing SKUs from your system without careful planning creates operational chaos. Follow a measured, phased approach instead.
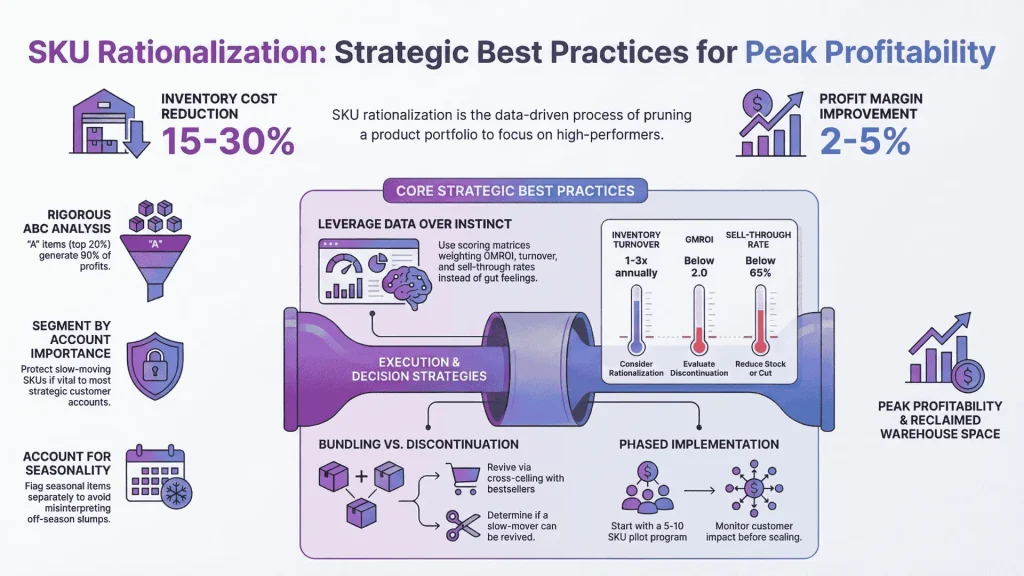
Start with pilot discontinuations. Choose 5-10 low-risk SKUs and discontinue them carefully. Monitor customer impact, operational disruption, and actual cost savings realized. Use results to refine your approach before scaling broadly.
Communicate clearly with all stakeholders: warehouse teams, sales, customer service, and procurement. Explain discontinuation reasoning, customer request handling, and expected benefits. Resistance is natural; transparency reduces it substantially.
Set clear discontinuation timelines. Customers need advance notice. Warehouses need time clearing inventory. Sales needs revenue adjustment planning. Typically, 4-12 weeks from announcement to discontinuation works well, depending on current inventory levels.
Pro Tip: After implementation, monitor key metrics religiously for 90 days. Did you achieve targets? Did you cut too aggressively? Use results to guide future rationalization rounds and adjust your SKU management strategy accordingly.
Key Metrics for SKU Performance Evaluation
Evaluating SKU performance requires multiple integrated metrics. No single number tells the complete story of product value.
Reference Table: SKU Performance Metrics Interpretation
| Metric | Strong | Moderate | Weak | Action |
| Inventory Turnover | 8-12x annually | 4-7x annually | 1-3x annually | Consider rationalization |
| GMROI | Above 5.0 | 2.0-5.0 | Below 2.0 | Evaluate for discontinuation |
| Sell-Through Rate | 85%+ | 65-85% | Below 65% | Reduce inventory or discontinue |
| Days Inventory Outstanding | 30-60 days | 61-90 days | 90+ days | Review demand planning |
| Gross Margin % | 35%+ | 20-35% | Below 20% | Evaluate profitability |
Sales Velocity and Revenue Contribution
Sales velocity measures how quickly inventory moves. Calculate it by dividing total units sold by average inventory on hand. Velocity of 12 means inventory turns 12 times yearly, or roughly every month.
Revenue contribution shows what percentage of total sales each SKU generates. An A-SKU might generate 8% of revenue while representing 1% of your SKU count. C-SKUs often contribute less than 0.5% each despite occupying shelf space and inventory carrying costs.
Profitability and Margin Analysis
Revenue without profit is vanity. Calculate gross margin (revenue minus COGS) for each SKU in your portfolio. Some low-revenue items have excellent margins; some bestsellers barely break even after cost of goods sold.
Consider contribution margin, the revenue remaining after subtracting variable costs. This shows what each SKU contributes toward covering fixed costs and generating actual profit. High-margin SKUs deserve protection even with moderate sales volumes.
Inventory Turnover Rate and GMROI
Inventory turnover rate measures how many times you sell and replace inventory annually. Formula: cost of goods sold divided by average inventory value. High turnover (8-12 times) indicates healthy demand. Low turnover (1-2 times) suggests excess inventory.
GMROI (Gross Margin Return on Investment) calculates gross margin dollars returned per dollar invested in inventory. Formula: gross margin dollars divided by average inventory cost. A GMROI of 3 means generating $3 in gross margin for every $1 of inventory investment.
High GMROI SKUs (above 5) are efficient inventory investments. Low GMROI SKUs (below 1) tie up capital without adequate profit generation. GMROI is particularly valuable for retail and ecommerce inventory management because it links profitability directly to inventory investment.
Sell-Through Rate and Backorder Frequency
Sell-through rate measures what percentage of received inventory actually sells. Receiving 100 units and selling 90 means 90% sell-through. Rates above 85% indicate healthy demand and proper inventory levels. Rates below 65% signal overstock.
Backorder frequency reveals insufficient inventory. High backorder rates on supposedly mid-performing SKUs might indicate they are actually strong performers being undersupplied. This warrants investigation before discontinuation decisions.
SKU Rationalization Best Practices and Strategies
Successful rationalization follows proven patterns. These practices reduce risk and improve outcomes significantly.
Segment Your Portfolio Using ABC Analysis Rigorously
Do not apply identical rationalization criteria to all SKUs. A-SKUs deserve fierce protection; pour resources into ensuring they are always in stock and competitively priced. B-SKUs need monitoring but are not immediate rationalization priorities. C-SKUs warrant ruthless scrutiny.
Within each segment, set specific metric thresholds. Example: “Discontinue C-SKUs with less than 10 units sold annually AND gross margin below 30%.” Different thresholds for different segments prevent over-cutting and protect strategic items effectively.
Evaluate by Customer Segment and Account Importance
Product-level sales obscure important patterns. A slow-moving SKU might be vital to retaining your largest customer. Conversely, it might appeal exclusively to low-margin customer segments.
Analyze sales and profitability by customer segment when possible. This reveals products punching above their weight with strategic accounts. These deserve preservation even if overall metrics appear weak.
Account Explicitly for Seasonal and Promotional Products
Seasonal items show terrible metrics during off-season months. Evaluating January holiday item performance leads to incorrect decisions. Build seasonality into analysis. Flag seasonal SKUs separately and judge them on peak-season performance.
Promotional product SKUs similarly will not show strong turnover metrics. Identify these explicitly to avoid rationalizing products serving specific marketing purposes. Track their contribution to bundling strategies and cross-sell opportunities.
Plan for Change Management and Stakeholder Alignment
Organizational resistance kills rationalization efforts. Sales teams fear losing commissions. Operations teams worry about customer complaints. Manufacturing worries about setup costs. Finance worries about revenue decline.
Address resistance head-on. Involve key stakeholders early. Share data showing the business case. Explain how cost savings create opportunities: new product launches, marketing investment, or hiring. Celebrate simplification benefits beyond cost cutting alone.
Create clear governance for discontinuation decisions. Who decides? How are customer requests handled? What is the timeline? Transparency prevents paralysis and repeated second-guessing.
Leverage Data and Automation Over Gut Instinct
Emotion and intuition have no place in SKU rationalization decisions. A product you think is failing might be vital to a customer. A personal favorite might hemorrhage money.
Use scoring frameworks weighting multiple metrics. Automate analysis by building dashboards that flag low-GMROI items or slow-turning SKUs automatically. Let data drive decisions. This protects you politically: decisions based on metrics, not preferences, withstand scrutiny.
Common Mistakes to Avoid in SKU Rationalization
Learning from others’ failures prevents repeating costly errors. Watch for these critical pitfalls.
Relying on Historical Data Without Forward-Looking Signals
Last year’s sales do not predict next year’s demand. Weak historical performance does not mean permanent underperformance. A product gaining traction with new customer segments might be emerging. Conversely, bestsellers face obsolescence risk.
Combine historical data with forward-looking demand planning analysis. Talk to sales teams. What products are customers requesting? What is your competitive landscape? Are new technologies making products obsolete? Incorporate this context into decisions.
Ignoring Bundling and Cross-Sell Opportunities
Before discontinuing slow-moving SKUs, ask whether bundling might revive them. That slow cable paired with a bestseller widget might drive incremental revenue. Sometimes repositioning through bundling works better than discontinuation.
Cross-sell opportunities work similarly. A customer buying product A might want product B. If B is slow-moving, better bundling or targeted marketing might unlock hidden value instead of rationalization.
Underestimating Organizational Resistance
Discontinuing products creates real disruption. Salespeople lose commissions. Customers lose favorites. Warehouse staff lose perfected processes. This resistance derails initiatives if not carefully managed.
Expect and plan for resistance proactively. Build change management into project timelines. Communicate early, often, and transparently. Celebrate wins. Address customer concerns professionally. Give teams time adjusting to new processes.
Cutting Products Too Aggressively
The temptation to eliminate costs quickly is strong under budget pressure. Aggressive rationalization risks losing customer segments or alienating your sales team. A 40% SKU reduction might cause 15% revenue loss, which is unacceptable for most businesses.
Set conservative initial targets. Start with 10-15% SKU reduction from C-segments. Measure results carefully. Rationalize further if outcomes support scaling. Gradual rationalization allows adjustment before reaching breaking points.
Failing to Monitor Post-Implementation Results
Rationalization does not end at product discontinuation. Monitor actual impact rigorously. Are customers complaining? Did revenue drop more than expected? Are sales teams unhappy? Early warning signs let you adjust course.
Build quarterly monitoring into your operations. Review actual versus projected savings. Track customer complaints about discontinued products. Adjust rationalization criteria based on learning. Your first rationalization pass will not be perfect; iteration is expected and normal.
Technology and Tools Supporting SKU Rationalization
Manual spreadsheet analysis of hundreds or thousands of SKUs is error-prone and time-consuming. Modern inventory optimization software automates heavy lifting.
Capabilities to Seek in Rationalization Software
Strong SKU rationalization solutions should calculate GMROI automatically across catalogs. They should segment inventory using ABC analysis and flag discontinuation candidates. They should model discontinuation impact: projected revenue loss, cost savings realized, and margin implications.
Demand sensing capabilities surface forward-looking signals effectively. If product demand is accelerating despite current low sales, good software flags this. Declining demand trends help identify candidates before they become dead stock.
Collaboration features involve stakeholders in decision-making. Sales can protect strategic products. Finance can track expected savings. Supply chain can manage implementation timelines. Good tools create shared workspaces for rationalization decisions, reducing conflict.
Integration with Existing Systems and Workflows
Your rationalization tool must integrate with your ERP, inventory management system, and potentially demand planning platforms. Manual data entry defeats the purpose entirely. Real-time data feeds ensure analysis stays current.
Ensure tools export decisions in formats your team uses: Excel, PDFs, and standard reports. Integration with existing workflows reduces friction and adoption resistance.
Frequently Asked Questions
What is an example of SKU rationalization?
A grocery chain carried 850 SKUs across frozen vegetables. Analysis showed 60% of sales came from 45 core items. The chain discontinued 200 slow-moving varieties, reducing inventory carrying costs by $180,000 annually. Sell-through rates on remaining items increased 12%, and customer shopping time decreased because simplified selection improved decision-making.
What does SKU mean, and why does it matter?
SKU stands for stockkeeping unit, a unique identifier for each product variant you stock. It matters because it enables tracking, management, and analysis at the finest detail level. Without SKUs, you cannot measure performance accurately or make informed inventory optimization decisions.
How frequently should we rationalize SKUs?
Most businesses benefit from formal rationalization annually or semi-annually. After your initial rationalization, establish quarterly review processes. Flag new slow-movers and bundling opportunities. Conduct comprehensive analysis every 12-18 months. Avoid continuous churn, as stability matters to customers and warehouse operations.
What is an SKU strategy, and how does rationalization fit in?
An SKU strategy defines which products you offer, variant counts, and business model alignment. Rationalization is the execution mechanism ensuring your actual inventory matches intended strategy. Without strategy, rationalization becomes random cutting. With strategy, it becomes focused optimization.
How do we handle customer requests for discontinued products?
Communicate early and clearly before discontinuing. Give customers 4-12 weeks notice and suggest viable alternatives. After discontinuation, maintain short lists of alternatives to recommend when customers request discontinued items. Some businesses reserve small quantities of discontinued items for loyal customers, preserving relationships with minimal cost impact.
Key Takeaways and Action Plan
SKU rationalization is the strategic pruning that transforms overgrown product portfolios into focused, profitable operations. The core insight is straightforward: most companies carry 50% more SKUs than necessary, costing them 15-30% of potential inventory profitability.
The path forward is equally clear. Define measurable goals. Analyze portfolios using ABC analysis and performance frameworks. Make data-driven discontinuation decisions. Implement carefully with phased approaches. Monitor results rigorously and adjust based on learning.
Avoid critical pitfalls: cutting too aggressively, ignoring organizational change management, overlooking seasonal patterns, and relying on instinct instead of data.
Start this week. Pull your inventory data and identify your top 20% of SKUs by revenue. Calculate current GMROI across your portfolio. Estimate inventory carrying costs tied up in your bottom 30% of products. This analysis alone often justifies the rationalization initiative to stakeholders.
Choose your implementation path: do-it-yourself with spreadsheets and internal resources, or leverage inventory optimization software automating the analysis. Either approach, well-executed SKU rationalization delivers 2-5% margin improvement, 15-30% inventory cost reduction, and enhanced customer experience. Those results justify the effort and investment required.