


Running a retail business without tracking key performance indicators is like driving blindfolded. You might move forward, but you have no idea if you’re heading in the right direction or about to crash.
Retail KPIs give you the visibility you need to make smarter decisions about inventory, pricing, staffing, and customer engagement. They transform gut feelings into actionable data and help you spot problems before they become costly mistakes.
This guide breaks down the 25 most important retail KPIs across five critical categories: inventory management, sales and revenue, customer behavior, ecommerce operations, and employee performance. For each metric, you’ll find the formula, a practical example, and clear guidance on why it matters for your business.
What Are Retail KPIs and Why Do They Matter?
A retail KPI (key performance indicator) is a quantifiable metric that measures how effectively your business achieves its objectives. Unlike raw data points, KPIs connect directly to specific business goals and provide a clear benchmark for success or failure.
Tracking retail KPIs delivers measurable benefits for your business:
- Eliminates guesswork. Instead of assuming a product sells well because the shelf looks emptier, you can see exact sell-through rates and compare performance across locations.
- Improves resource allocation. When you know which products generate the highest margins and which employees drive the most sales, you can make informed decisions about inventory investment and scheduling.
- Creates accountability. Teams perform better when they have clear targets and can see their progress in real time.
- Provides early warning signals. A declining inventory turnover rate signals potential cash flow problems weeks before they become critical.
- Enables faster course correction. By monitoring indicators consistently, you can address small issues before they become major setbacks.
The most successful retailers treat KPIs as a strategic compass. They don’t just collect data; they use it to guide every decision from purchasing to pricing to personnel.
How to Choose the Right Retail KPIs for Your Business
Not every KPI applies to every retail operation. A boutique clothing store has different priorities than a wholesale distributor or an omnichannel brand selling through Shopify and Amazon simultaneously.
When selecting KPIs, follow these criteria:
- Start with your core business objectives and work backward to identify which metrics reflect progress toward those goals.
- Balance leading indicators (predictive metrics like conversion rate) with lagging indicators (outcome metrics like net profit).
- Choose KPIs you can actually influence through team actions and process improvements.
- Limit your primary dashboard to 5-7 key metrics to maintain focus.
- Ensure you have reliable systems in place to capture accurate data for each KPI.
Consider the distinction between leading and lagging indicators. Lagging indicators like net profit and year-over-year growth tell you what already happened. Leading indicators like conversion rate and foot traffic predict future performance. A balanced KPI dashboard includes both types so you can understand past results while anticipating what comes next.
Quick Reference: All 25 Retail KPIs at a Glance
| Category | KPI | Formula | Good Benchmark |
| Inventory | Inventory Turnover Rate | COGS / Average Inventory | 4-6x per year (varies by industry) |
| Inventory | Sell-Through Rate | (Units Sold / Units Received) x 100 | 70-80% |
| Inventory | GMROI | Gross Profit / Average Inventory Cost | Above 3.0 |
| Inventory | Shrinkage Rate | (Recorded – Actual Inventory) / Recorded x 100 | Below 2% |
| Inventory | Days of Inventory On Hand | Average Inventory / (COGS / 365) | 30-60 days |
| Sales | Sales per Square Foot | Net Sales / Selling Space (sq ft) | $300-$400 |
| Sales | Average Transaction Value | Total Revenue / Number of Transactions | Varies by category |
| Sales | Conversion Rate | (Transactions / Visitors) x 100 | 20-30% in-store |
| Sales | Year-over-Year Growth | ((Current – Prior Sales) / Prior Sales) x 100 | 3-5% minimum |
| Sales | Gross Profit Margin | ((Revenue – COGS) / Revenue) x 100 | 40-60% |
| Sales | Net Profit Margin | (Net Profit / Revenue) x 100 | 5-10% |
| Customer | Customer Retention Rate | ((End Customers – New) / Start Customers) x 100 | Above 60% |
| Customer | Customer Lifetime Value | ATV x Purchase Frequency x Lifespan | 3x CAC minimum |
| Customer | Customer Acquisition Cost | Total Acquisition Costs / New Customers | Below 1/3 of CLV |
| Customer | Foot Traffic | Total Visitors / Time Period | Location dependent |
| Customer | Net Promoter Score | % Promoters – % Detractors | Above 30 |
| Ecommerce | Cart Abandonment Rate | ((Carts – Purchases) / Carts) x 100 | Below 70% |
| Ecommerce | Online vs. In-Store Ratio | Online Revenue / Total Revenue x 100 | Business dependent |
| Ecommerce | Order Fulfillment Rate | (Orders Fulfilled / Total Orders) x 100 | Above 97% |
| Employee | Sales per Employee | Net Sales / Number of Employees | Industry dependent |
| Employee | Employee Turnover Rate | (Employees Left / Average Employees) x 100 | Below 30% |
Inventory Management KPIs
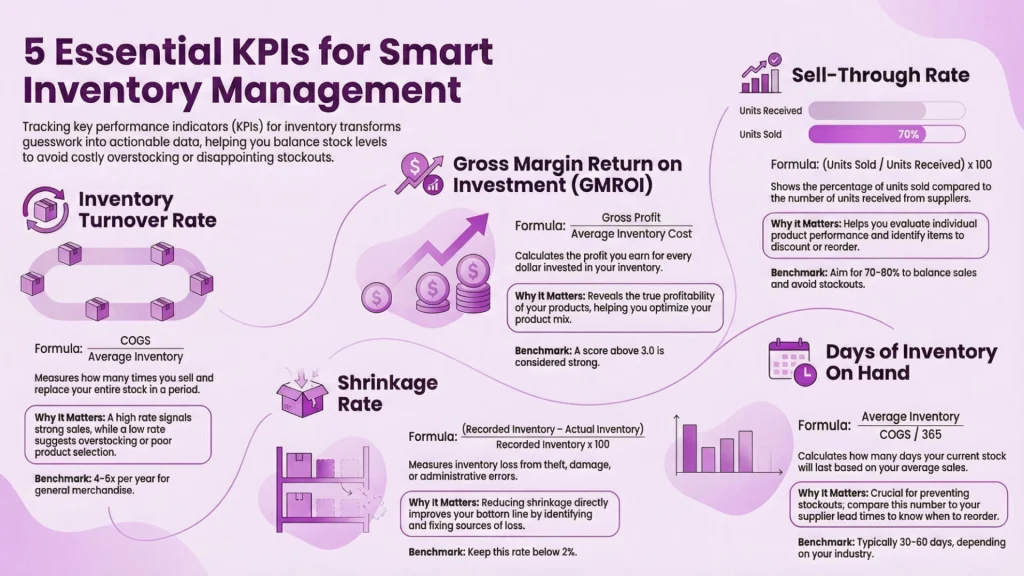
Inventory sits at the heart of every retail operation. Too much stock ties up cash and increases storage costs. Too little means lost sales and disappointed customers. These five KPIs help you find the optimal balance.
Inventory Turnover Rate
Inventory turnover measures how many times you sell and replace your stock during a specific period. It reveals how efficiently your inventory converts into revenue.
Formula:
Inventory Turnover Rate = Cost of Goods Sold / Average Inventory Value
Example:
A home goods retailer has $480,000 in annual cost of goods sold and maintains an average inventory value of $80,000. Their inventory turnover rate equals 6 ($480,000 / $80,000), meaning they sell through their entire inventory six times per year, or roughly every two months.
Why it matters:
A high turnover rate generally indicates strong sales and efficient inventory management. A low rate suggests overstocking, poor product selection, or pricing issues. However, context matters. Luxury goods naturally turn over more slowly than everyday consumables. Compare your turnover rate against industry benchmarks and your own historical performance rather than arbitrary targets.
Industry Benchmarks for Inventory Turnover:
| Retail Category | Average Turnover Rate | Optimal Range |
| Grocery and perishables | 14-20x per year | 15-25x |
| Fast fashion and apparel | 4-6x per year | 5-8x |
| General merchandise | 4-6x per year | 5-7x |
| Electronics | 5-8x per year | 6-10x |
| Home goods and furniture | 2-4x per year | 3-5x |
| Luxury goods and jewelry | 1-2x per year | 1.5-3x |
| Sporting goods | 3-4x per year | 4-6x |
Sell-Through Rate
Sell-through rate shows what percentage of inventory you sold compared to what you received from suppliers during a specific period.
Formula:
Sell-Through Rate = (Units Sold / Units Received) x 100
Example:
A sporting goods store receives 200 basketball shoes at the start of the quarter and sells 150 by quarter’s end. Their sell-through rate is 75% (150 / 200 x 100), leaving 50 pairs in stock.
Why it matters:
This metric helps you evaluate product performance and time your restocks appropriately. A sell-through rate approaching 100% means you’re at risk of stockouts. A rate below 50% suggests weak demand or overordering. Track sell-through by SKU to identify which products deserve more shelf space and which should be discounted or discontinued.
Gross Margin Return on Investment (GMROI)
GMROI measures the profit you generate for every dollar invested in inventory. It combines margin analysis with inventory efficiency into a single powerful metric.
Formula:
GMROI = Gross Profit / Average Inventory Cost
Example:
A jewelry retailer earns $120,000 in gross profit on a product category with an average inventory investment of $40,000. Their GMROI equals 3 ($120,000 / $40,000), meaning every dollar invested in inventory generates $3 in gross profit.
Why it matters:
GMROI helps you compare profitability across product categories with very different characteristics. A high-margin item with slow turnover might generate the same GMROI as a low-margin item that sells quickly. Use this metric to optimize your product mix and identify which categories deserve more investment.
Shrinkage Rate
Shrinkage measures inventory loss from theft, damage, administrative errors, or supplier fraud. It represents the gap between your recorded inventory and what physically exists.
Formula:
Shrinkage Rate = (Recorded Inventory Value – Actual Inventory Value) / Recorded Inventory Value x 100
Example:
A convenience store’s inventory system shows $50,000 in stock, but a physical count reveals only $48,500 worth of products. Their shrinkage rate is 3% (($50,000 – $48,500) / $50,000 x 100).
Why it matters:
The National Retail Federation estimates shrinkage costs US retailers over $100 billion annually. Tracking this metric helps you identify problem areas, whether that’s a specific store location with security issues, a product category prone to theft, or systematic receiving errors. Reducing shrinkage directly improves your bottom line.
Days of Inventory On Hand
This metric calculates how many days your current inventory will last based on average daily sales velocity.
Formula:
Days of Inventory On Hand = Average Inventory / (Cost of Goods Sold / 365)
Example:
A pet supply retailer maintains $60,000 in average inventory and has annual COGS of $438,000. Their daily COGS equals $1,200 ($438,000 / 365). Days of inventory on hand equals 50 days ($60,000 / $1,200).
Why it matters:
This KPI helps you avoid stockouts by revealing how quickly you’ll deplete current inventory. Compare days of inventory against supplier lead times to ensure you reorder before running out. If your supplier needs 30 days to deliver and you have 50 days of inventory, you have a 20-day buffer. If lead time exceeds days on hand, you’re heading for a stockout.
Calculate these inventory KPIs
To work out inventory turnover rate and days of inventory on hand for your own numbers, use the free inventory turnover calculator: enter COGS, beginning inventory and ending inventory and it returns your turnover rate and days sales of inventory (DSI).
To work out sell-through rate, use the free sell-through rate calculator: enter units sold and units received and it returns your sell-through percentage.
To work out GMROI, use the free GMROI calculator: enter revenue, COGS and average inventory at cost and it returns your gross margin return on investment.
Sales and Revenue KPIs
Revenue metrics reveal the health of your business and the effectiveness of your pricing, merchandising, and sales strategies. These six KPIs provide a comprehensive view of sales performance.
Sales per Square Foot
For brick-and-mortar retailers, sales per square foot measures how efficiently your physical space generates revenue.
Formula:
Sales per Square Foot = Net Sales / Total Selling Space (sq ft)
Example:
A fashion boutique occupies 1,200 square feet of selling space and generates $360,000 in annual net sales. Their sales per square foot equals $300 ($360,000 / 1,200).
Why it matters:
This metric helps you evaluate store productivity and compare performance across locations of different sizes. If one store generates $400 per square foot while another produces $200, investigate what drives the difference. Store layout, product assortment, local demographics, and staff performance all impact this KPI. Use insights to optimize underperforming locations or justify expansion investments.
Average Transaction Value (ATV)
Average transaction value, also called average order value, measures how much customers spend per purchase.
Formula:
Average Transaction Value = Total Revenue / Number of Transactions
Example:
A kitchenware store processes 2,500 transactions in a month, generating $187,500 in revenue. Their average transaction value equals $75 ($187,500 / 2,500).
Why it matters:
Increasing ATV directly boosts revenue without requiring additional customers. Train staff on upselling and cross-selling techniques. Bundle complementary products. Offer free shipping thresholds or loyalty rewards that encourage larger purchases. Track ATV by employee to identify top performers whose techniques can be shared across the team.
Conversion Rate
Conversion rate measures what percentage of store visitors become paying customers.
Formula:
Conversion Rate = (Number of Transactions / Number of Visitors) x 100
Example:
A furniture showroom welcomes 800 visitors in a week and completes 120 sales. Their conversion rate equals 15% (120 / 800 x 100).
Why it matters:
Traffic means nothing without conversions. This KPI reveals how effectively your store environment, product selection, pricing, and staff convert browsers into buyers. A low conversion rate might indicate pricing issues, poor merchandising, inadequate staffing, or a mismatch between marketing promises and in-store reality. Track conversion alongside traffic to understand whether you have a visitor problem or a closing problem.
Year-over-Year Sales Growth
This metric compares revenue from a specific period against the same period in the previous year, accounting for seasonal variations.
Formula:
YoY Sales Growth = ((Current Period Sales – Prior Year Sales) / Prior Year Sales) x 100
Example:
A toy retailer generated $280,000 in Q4 this year compared to $250,000 in Q4 last year. Their year-over-year growth equals 12% (($280,000 – $250,000) / $250,000 x 100).
Why it matters:
YoY growth provides a normalized view of business trajectory that smooths out monthly fluctuations. Consistent positive growth indicates a healthy, expanding business. Declining growth signals the need for strategic intervention. Compare your growth rate against industry averages to understand whether you’re gaining or losing market share.
Gross Profit Margin
Gross profit margin shows what percentage of revenue remains after covering the direct costs of goods sold.
Formula:
Gross Profit Margin = ((Revenue – Cost of Goods Sold) / Revenue) x 100
Example:
An electronics retailer generates $500,000 in revenue with $350,000 in COGS. Their gross profit margin equals 30% (($500,000 – $350,000) / $500,000 x 100).
Why it matters:
Gross margin reveals whether your pricing strategy and supplier negotiations leave enough room to cover operating expenses and generate profit. Track margins by product category to identify which items contribute most to profitability. If margins decline over time, investigate whether costs are rising or competitive pressure is forcing price reductions.
Net Profit Margin
Net profit margin shows what percentage of revenue remains after all expenses, including operating costs, interest, and taxes.
Formula:
Net Profit Margin = (Net Profit / Revenue) x 100
Example:
A garden center generates $800,000 in annual revenue and $64,000 in net profit. Their net profit margin equals 8% ($64,000 / $800,000 x 100).
Why it matters:
This is the ultimate measure of business health. A positive net margin means your operation generates real profit. A negative margin indicates you’re losing money despite generating revenue. Compare net margin against industry benchmarks to evaluate operational efficiency. If your gross margin is healthy but net margin is weak, focus on reducing operating expenses.
To work out gross profit margin for your own numbers, use the free gross margin calculator: enter revenue and COGS, or unit price and unit cost, and it returns your gross margin and markup.
Customer KPIs
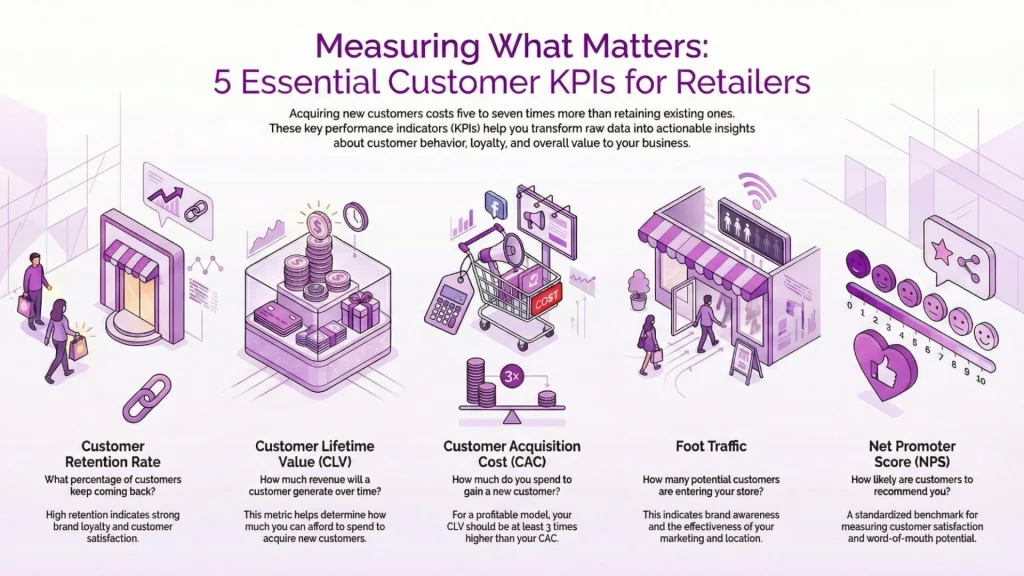
Acquiring new customers costs five to seven times more than retaining existing ones. These customer-focused KPIs help you understand who buys from you, how often they return, and how much value they represent over time.
Customer Retention Rate
Customer retention rate measures what percentage of customers continue purchasing from you over a specific period.
Formula:
Customer Retention Rate = ((Customers at End of Period – New Customers Acquired) / Customers at Start of Period) x 100
Example:
A beauty supply store starts the year with 2,000 customers, acquires 600 new customers, and ends with 2,100 total customers. Their retention rate equals 75% ((2,100 – 600) / 2,000 x 100), meaning they retained 1,500 of their original 2,000 customers.
Why it matters:
High retention indicates customer satisfaction and strong brand loyalty. Low retention suggests product quality issues, poor service, or competitive alternatives drawing customers away. Improving retention by just 5% can increase profits by 25% to 95% according to research from Bain & Company.
Proven strategies to improve customer retention include:
- Implementing a loyalty program with meaningful rewards
- Sending personalized post-purchase follow-up communications
- Offering exclusive early access to new products for repeat customers
- Providing exceptional customer service that exceeds expectations
- Creating subscription or auto-replenishment options for consumable products
- Gathering and acting on customer feedback to continuously improve
Invest in these retention initiatives to keep customers coming back and maximize lifetime value.
Customer Lifetime Value (CLV)
CLV estimates the total revenue you can expect from a single customer throughout their relationship with your business.
Formula:
Customer Lifetime Value = Average Transaction Value x Purchase Frequency x Average Customer Lifespan
Example:
A coffee equipment retailer finds their average customer spends $150 per transaction, purchases twice per year, and remains a customer for five years. Their CLV equals $1,500 ($150 x 2 x 5).
Why it matters:
CLV helps you determine how much you can afford to spend acquiring new customers while remaining profitable. It also identifies your most valuable customer segments so you can tailor marketing and service accordingly. If certain product categories or acquisition channels produce higher CLV customers, prioritize those areas.
Customer Acquisition Cost (CAC)
CAC measures how much you spend to acquire each new customer, including marketing, advertising, and sales expenses.
Formula:
Customer Acquisition Cost = Total Acquisition Costs / Number of New Customers Acquired
Example:
A fitness apparel brand spends $25,000 on marketing in a quarter and acquires 500 new customers. Their CAC equals $50 ($25,000 / 500).
Why it matters:
Compare CAC against CLV to ensure you’re acquiring customers profitably. If your CAC exceeds CLV, you’re losing money on every new customer. Track CAC by channel to identify the most cost-effective acquisition methods. Organic search, referrals, and repeat customers typically have lower acquisition costs than paid advertising.
Foot Traffic
Foot traffic counts how many people enter your physical retail location during a specific period.
Formula:
Foot Traffic = Total Store Visitors / Time Period
Example:
A bookstore records 3,500 visitors during a week. Their daily average foot traffic equals 500 (3,500 / 7).
Why it matters:
Foot traffic indicates brand awareness, marketing effectiveness, and location quality. Compare traffic against conversion rates to understand whether you have a visitor acquisition problem or a sales problem. Analyze traffic patterns by day and hour to optimize staffing schedules and promotional timing.
Net Promoter Score (NPS)
NPS measures customer loyalty by asking how likely customers are to recommend your business on a scale of 0 to 10.
Formula:
NPS = Percentage of Promoters (9-10) – Percentage of Detractors (0-6)
Example:
A survey of 200 customers reveals 120 promoters (60%), 50 passives (25%), and 30 detractors (15%). The NPS equals 45 (60 – 15).
Why it matters:
NPS provides a standardized benchmark for customer satisfaction and loyalty. Scores above 0 indicate more promoters than detractors. Scores above 50 are considered excellent. Track NPS over time and after significant changes to understand their impact on customer perception. Follow up with detractors to address concerns and potentially convert them into promoters.
Ecommerce and Omnichannel KPIs
Modern retailers sell through multiple channels. These KPIs help you understand online performance and optimize the connection between digital and physical experiences.
Cart Abandonment Rate
Cart abandonment rate measures what percentage of online shoppers add items to their cart but leave without completing the purchase.
Formula:
Cart Abandonment Rate = ((Carts Created – Completed Purchases) / Carts Created) x 100
Example:
An online home decor store sees 1,000 shopping carts created in a week but only 280 completed purchases. Their cart abandonment rate equals 72% ((1,000 – 280) / 1,000 x 100).
Why it matters:
The average cart abandonment rate across industries hovers around 70%, but every recovered cart represents additional revenue. Common causes of cart abandonment include:
- Unexpected shipping costs revealed at checkout
- Complicated or lengthy checkout process
- Required account creation before purchase
- Limited payment options
- Security concerns or lack of trust signals
- Website errors or slow loading times
Implement abandoned cart emails to recover lost sales and address the root causes driving customers away.
Online vs. In-Store Sales Ratio
This metric compares revenue generated through digital channels against physical store sales.
Formula:
Online Sales Ratio = Online Revenue / Total Revenue x 100
Example:
An outdoor gear retailer generates $1.2 million in total annual revenue, with $420,000 from online sales. Their online sales ratio equals 35% ($420,000 / $1,200,000 x 100).
Why it matters:
Understanding channel mix helps you allocate resources appropriately between digital marketing and physical store operations. Track how this ratio shifts over time and in response to external factors. Many retailers saw dramatic shifts toward online during the pandemic that have since partially reversed. Your optimal ratio depends on product type, customer preferences, and competitive positioning.
Order Fulfillment Rate
Order fulfillment rate measures what percentage of orders you successfully complete and ship without issues.
Formula:
Order Fulfillment Rate = (Orders Successfully Fulfilled / Total Orders) x 100
Example:
A supplements retailer receives 5,000 orders in a month and successfully fulfills 4,850 without errors or stockouts. Their fulfillment rate equals 97% (4,850 / 5,000 x 100).
Why it matters:
Fulfillment failures damage customer trust and generate costly returns, replacements, and support inquiries. A rate below 95% indicates systemic problems requiring immediate attention. Common issues include inventory inaccuracies, picking errors, and supplier delays. Invest in inventory management systems that provide real-time visibility across all locations and sales channels.
Employee Performance KPIs
Your staff directly impacts customer experience, sales results, and operational efficiency. These metrics help you identify top performers, address underperformance, and optimize scheduling.
Sales per Employee
Sales per employee measures the average revenue generated by each team member.
Formula:
Sales per Employee = Total Net Sales / Number of Employees
Example:
A sporting goods store with eight employees generates $640,000 in annual sales. Their sales per employee equals $80,000 ($640,000 / 8).
Why it matters:
This KPI helps you evaluate staffing efficiency and set realistic sales targets. Compare against industry benchmarks to understand whether you’re over or understaffed. Track individual employee performance to identify coaching opportunities and reward top contributors. Use historical data to forecast seasonal staffing needs.
Employee Turnover Rate
Employee turnover measures what percentage of your workforce leaves during a specific period.
Formula:
Employee Turnover Rate = (Employees Who Left / Average Number of Employees) x 100
Example:
A retail chain with an average of 50 employees sees 15 departures during the year. Their turnover rate equals 30% (15 / 50 x 100).
Why it matters:
High turnover increases hiring and training costs while reducing team expertise and customer service quality. The retail industry averages around 60% annual turnover, but top performers achieve much lower rates. Exit interviews help identify why employees leave. Address common concerns around compensation, scheduling, career development, and workplace culture to improve retention.
How Often Should You Track Each KPI?
Not all metrics require the same monitoring frequency. Use this framework to establish your tracking rhythm:
| Frequency | KPIs to Track | Purpose |
| Daily | Net sales, conversion rate, foot traffic, inventory levels, order fulfillment rate | Spot immediate issues and respond quickly |
| Weekly | Sales per employee, average transaction value, cart abandonment rate, shrinkage alerts | Identify trends and adjust tactics |
| Monthly | Inventory turnover, sell-through rate, customer retention, gross margin, YoY growth | Evaluate strategy effectiveness |
| Quarterly | Customer lifetime value, CAC, NPS, GMROI, employee turnover, net profit margin | Inform strategic planning and forecasting |
The key is establishing consistent rhythms that allow you to spot trends and respond appropriately without drowning in data.
How Technology Simplifies Retail KPI Tracking
Manually tracking KPIs across spreadsheets and disconnected systems wastes time and introduces errors. Modern inventory management platforms automate data collection and present insights through real-time dashboards.
The most effective solutions unify data from all your sales channels, warehouses, and accounting systems into a single source of truth. When your Shopify store, Amazon listings, WooCommerce site, and physical locations all feed into one system, you get accurate, comprehensive visibility without manual reconciliation.
When evaluating retail technology platforms, look for these capabilities:
- Real-time synchronization across all sales channels and warehouse locations
- Pre-built reports for the KPIs that matter most to retail operations
- Customizable dashboards with drill-down capability by product, location, or time period
- Automated alerts when metrics fall outside acceptable ranges
- Native integration with accounting software like QuickBooks and Xero
- Demand forecasting to optimize replenishment decisions
- Mobile access for monitoring performance from anywhere
The right technology investment pays for itself through reduced manual work, fewer errors, better inventory decisions, and faster response to emerging opportunities or problems.
Retail KPI Dashboard: What to Include
An effective KPI dashboard presents the most critical metrics at a glance without overwhelming users with excessive data. Design your dashboard around three tiers of information.
Tier 1: Executive Summary (3-5 metrics)
Display your most important KPIs with clear visual indicators showing current status and trend direction:
- Net sales (current period vs. target and prior year)
- Gross profit margin
- Inventory turnover rate
- Customer retention rate
- Overall conversion rate
Tier 2: Category Summaries
Group related metrics together so users can quickly scan to identify which areas need attention:
- Inventory health: turnover, sell-through, days on hand, shrinkage
- Sales performance: ATV, sales per square foot, YoY growth
- Customer metrics: CLV, CAC, NPS, retention rate
- Operations: fulfillment rate, employee productivity
Tier 3: Drill-Down Detail
Enable clicking on any summary metric to reveal detailed breakdowns by product, location, time period, or other relevant dimensions. This allows managers to investigate anomalies without cluttering the main view.
Include comparison benchmarks wherever possible. Show current performance against the same period last year, against targets, and against company averages. Context transforms raw numbers into actionable insights.
FAQ: Retail KPIs
What is a KPI in retail?
A retail KPI is a quantifiable metric that measures progress toward specific business objectives. Unlike general data points, KPIs connect directly to strategic goals and provide clear benchmarks for evaluating success. Common retail KPIs include inventory turnover, conversion rate, average transaction value, and customer retention rate.
What are the top 5 retail KPIs?
While the most important KPIs vary by business type and goals, five universally valuable metrics include: inventory turnover rate (how efficiently you move stock), gross profit margin (pricing and cost management), conversion rate (sales effectiveness), customer retention rate (loyalty and satisfaction), and sales per square foot or per employee (operational efficiency).
How often should you track retail KPIs?
Track fast-moving metrics like sales, conversion rate, and inventory levels daily. Review operational KPIs like fulfillment rate and employee performance weekly. Analyze strategic metrics like customer lifetime value, year-over-year growth, and market share monthly or quarterly. The key is establishing consistent rhythms that allow you to spot trends and respond appropriately.
What is a good inventory turnover rate?
Ideal inventory turnover varies significantly by product category. Grocery and perishable goods might turn over 15 to 20 times annually. General retail averages 4 to 6 turns per year. Luxury goods and furniture might turn over only 2 to 3 times. Compare your turnover against industry benchmarks and your own historical performance rather than arbitrary targets.
How do you measure retail store performance?
Comprehensive retail performance measurement combines multiple KPI categories. Track sales metrics like revenue, average transaction value, and conversion rate. Monitor inventory efficiency through turnover and sell-through rates. Evaluate customer health via retention rate and satisfaction scores. Assess operational effectiveness through fulfillment rate and employee productivity. The complete picture emerges from analyzing these metrics together.
Take Control of Your Retail Performance
Tracking retail KPIs transforms how you run your business. Instead of reacting to problems after they've already impacted your bottom line, you can anticipate challenges and capitalize on opportunities while they're still emerging.
The key is building systems that make KPI tracking automatic and actionable. When data flows seamlessly from your sales channels, warehouses, and accounting software into unified dashboards, you spend less time gathering information and more time acting on insights.
Qoblex helps growing retailers do exactly that. Our inventory and order management platform connects your Shopify, WooCommerce, and Amazon stores with your warehouses and accounting systems to provide real-time visibility across your entire operation. Built-in reporting tracks the KPIs that matter most, from inventory turnover and sell-through rates to sales performance and demand forecasting.
See how Qoblex can simplify your retail operations. Start your free 14-day trial today and experience the clarity that comes from having all your data in one place.