



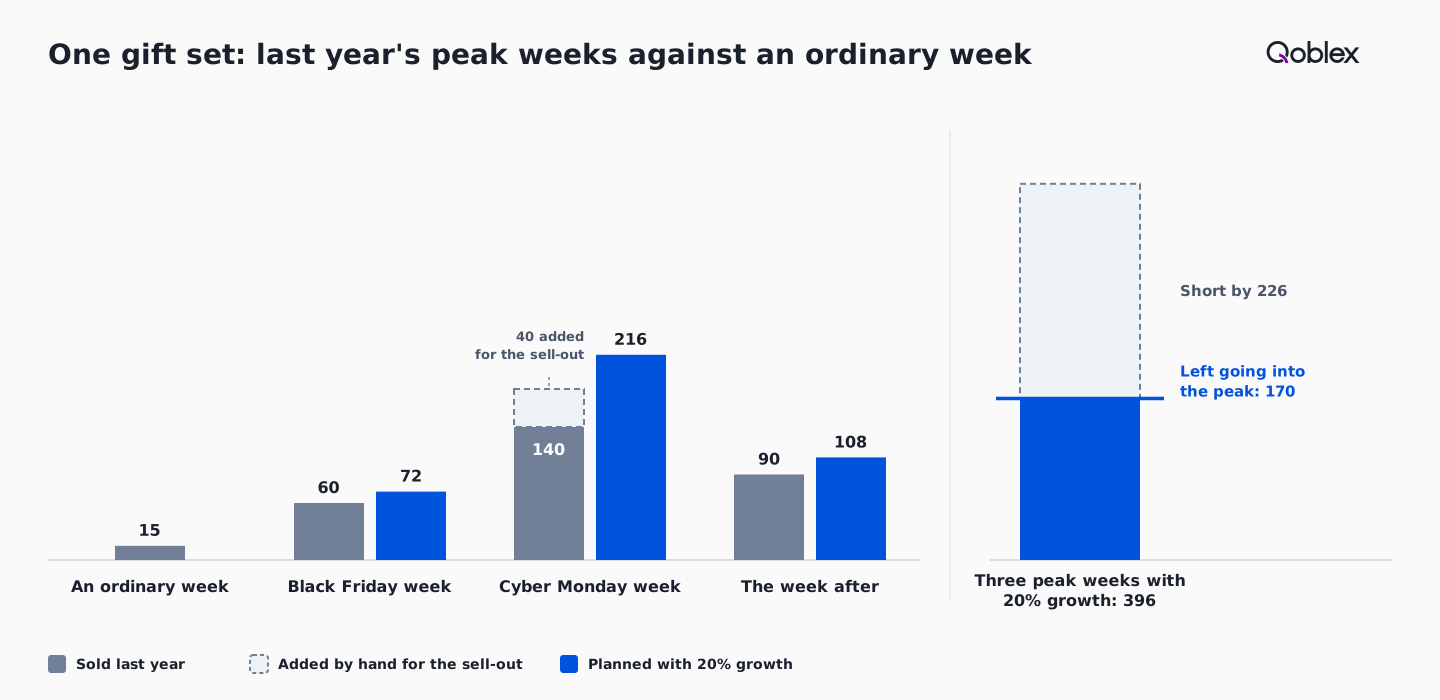
Buy for last year’s peak weeks, not for an average week. Take what the SKU sold in the same three weeks last year, 364 days earlier so the weekdays line up, correct any week it sold out in, add your own growth assumption, and subtract the stock you will have. In our example a gift set needs 396 units over three weeks against the 170 it will have going into the peak, so 226 units are short.
It is early November, and the peak order has to go out now. Sizing it the everyday way, a normal week’s sales times the weeks to cover, works all year but empties the shelf by Cyber Monday.
How much stock should a small brand order for Black Friday?
A small brand should order enough stock to cover what the product sold in the same peak weeks last year, plus its own growth assumption, minus the stock on hand and on order that will still be left when the peak starts, rather than a normal week’s sales multiplied by the weeks to cover.
In the example below, a gift set sells about 15 units in an ordinary week, so three weeks use 45 and the 170 units left going into the peak look like plenty. Last year the three peak weeks sold 290, about six times 45, and corrected for a sell-out and grown by 20% they need 396, leaving the brand 226 short.
The 20% is the brand’s own assumption, not a market figure; the wider market’s peak is in our Black Friday and Cyber Monday statistics piece. The order comes from the brand’s own sales, starting with which weeks to copy.
Which weeks of last year should this year’s order copy?
This year’s order should copy the same weeks of last year, counted back 364 days so the weekdays line up: Black Friday week of 23 to 29 November 2026 matches 24 to 30 November 2025, because Black Friday 2025 plus 364 days is Friday 27 November 2026.
The weeks here run Monday to Sunday, so Cyber Monday week, 1 to 7 December 2025, becomes 30 November to 6 December 2026, and the week after becomes 7 to 13 December. Both belong in the order, because that is where this brand’s stock went. Matching by calendar date slips, since 28 November is a Saturday in 2026; 364 days, exactly 52 weeks, keeps Friday on Friday.
Qoblex’s Seasonal forecast method does the same per week, copying what the variant sold in the matching week 364 days earlier. The buyer chooses it per variant under Forecast method, beside Historical Average and Trend, and because every variant starts on Historical Average, a seasonal gift set has to be switched to Seasonal.
What if the SKU did not exist last November?
A SKU that was launched this year has no matching week to copy, so the Seasonal method marks the period Insufficient history and forecasts it as zero.
The buyer then switches that SKU to Historical Average or Trend, or sizes its peak by hand from a similar SKU that did sell last November. Which SKU to borrow from, and how far to scale it, is the brand’s judgement, worth noting down for next year.
What does the arithmetic look like for one gift set?
For one gift-set SKU that sold 60, 140 and 90 units in last year’s three peak weeks, a 20% growth assumption makes 72, 216 and 108 units this year, 396 in all, against the 170 units left going into the peak, so the order is short by 226.
Let’s assume a small brand sells one gift set that it holds in stock like any other product, selling about 15 in an ordinary week last year. The brand now holds 120 units, has 100 more on an open purchase order due Monday 16 November, and expects to sell about 50 in the quiet weeks before Monday 23 November, so 170 units go into the peak.
| Last year's week | The matching week in 2026 | Sold last year | Corrected for the sell-out | With 20% growth | Stock left after the week (from 170) |
|---|---|---|---|---|---|
| 24 to 30 Nov 2025 (Black Friday week) | 23 to 29 Nov | 60 | 60 | 72 | 98 |
| 1 to 7 Dec 2025 (Cyber Monday week) | 30 Nov to 6 Dec | 140 | 180 | 216 | Short by 118 |
| 8 to 14 Dec 2025 | 7 to 13 Dec | 90 | 90 | 108 | Short by 226 |
| Total | 290 | 330 | 396 | 396 minus 170: 226 short |
The table is the brand’s own hand working, a sum anyone can do on paper. Its last column holds the decision: Black Friday week leaves 98 units against the 216 Cyber Monday week asks for, so the shortage starts in the week of Monday 30 November. The corrected 180 is more than it sold; the next section explains why.
What if the SKU sold out last Black Friday?
In Qoblex, a Seasonal forecast cannot correct a week in which the SKU sold out, because the Exclude stockout days setting has no effect on Seasonal variants, so the buyer adds the missed units by hand.
In the example, the Stock Movement report shows the gift set’s Closing Balance falling to 0 on Thursday 4 December 2025, with no further movement until stock was received on Monday 8 December, so Friday 5 to Sunday 7 December were three days with nothing to sell. So 140 is what the brand had, not what customers wanted, and Seasonal copies it as it stands. The setting is not at fault: on a Historical Average variant it drops out-of-stock days from the run rate, while Seasonal reads last year’s weeks instead. The variant’s chart in Qoblex shades Historical stockout periods, so the buyer can see the trap.
The week after sold 90, about 13 a day, so three lost days come to about 40 units and the brand treats Cyber Monday week as 180. That is a judgement, not a measurement, and a brand can be more cautious or less. With the 20% it becomes 216. On the Qoblex plan line the forecast has already grown the 140 it copied to 168, so the buyer adds about 48 units by hand, the 40 lost units grown by the same 20%.
When does the order have to be placed, and what if that date has passed?
The order date is the date the shortage starts minus the supplier’s lead time, so a 6-week supplier and a shortage starting in the week of Monday 30 November 2026 give Monday 19 October, which has already passed on 4 November.
Monday 30 November minus 42 days is Monday 19 October, 16 days before Wednesday 4 November, and that is before any receiving allowance, which our piece on Black Friday supplier lead times and last order dates covers. The 226 still matters: a supposed 2-week supplier gives Monday 16 November, still ahead, so the number says how much to source faster, or how far to size the promotion to the stock on hand and on order. On the Qoblex plan line, changing the supplier fills its Lead Time, and the read-only Receipt Date, not carried onto the created order, moves with it.
Coverage weeks starts at 12, and the proposed receipt covers the projected shortfall plus that many weeks of demand, more than a peak-only order wants, so the buyer lowers it or edits Quantity To Receive, the same number seen from the other side. A supplier with no lead time is planned at 0 days until someone sets Lead Time on the line. Next year, our suggestion is to run this sum in early October.
How do you forecast the Black Friday order in Qoblex?
Qoblex’s Forecasting V2 screen, available on the Business and Scale plans, projects each variant’s demand with a Seasonal method that copies the matching week 364 days earlier, then proposes a receipt that closes the projected shortfall plus Coverage weeks of demand, dated by working back through the supplier’s lead time.
The forecast is statistical, built from each variant’s sales; a Starter brand reaches the same answer by hand below. The projection starts from the stock held now, adds open purchase orders and subtracts forecast demand, and the first week below zero is the projected shortage. Only an approved, open purchase order counts as incoming, so the 100 units due on 16 November count because that order is open. The Forecasting help article covers each setting; see pricing for plans.
- On the gift set’s variant, set Forecast method to Seasonal, then open Forecasting V2 from the main menu.
- Open Parameters, set the Sales date filter to start before 24 November 2025, since every forecast method reads sales history inside that window and it covers only the last three months by default, then enter 20 in Growth factor (%), leaving Exclude stockout days alone, since it has no effect on Seasonal.
- Open the variant’s chart and read the shaded Historical stockout periods and the First projected shortage.
- Turn on Plan purchases and pick a Supplier strategy explicitly, since the control reads Quickest on load while the plan used Preferred.
- Check the line’s supplier and Lead Time, lower Coverage weeks or edit Quantity To Receive, and add the units the sell-out hid.
- Choose Review purchases and pick a receiving location for each order; Qoblex requires one.
- Create the orders, then fill in prices on each draft, since the lines have none.
- Approve the orders so they count as incoming stock; a draft does not, and the shortage returns on the next run.
The plan is the brand’s draft to overrule, and creating orders receives no stock. Keeping the stock for the promotion once it lands is in our lessons from the last two Black Fridays.
How do you work out the same order by hand from Stock Movement?
A Starter brand can work out the same order by hand from the Stock Movement report under Reporting, then Inventory, by filtering it to the SKU, setting the date range to each of last year’s peak weeks and reading the Shipped Quantity in the footer.
The Stock Movement report opens on the last 30 days, so the person who runs the stock count adds a filter for the gift set’s variant, widens the dates to 24 to 30 November 2025, reads the footer, which sums the movement columns over the rows in view, and repeats for the other two weeks. Shipped Quantity is what left the shelf, not what customers wanted, and in the example the row for Thursday 4 December 2025 shows Closing Balance at 0, with the next movement not until Monday 8 December.
From there the sum is the table above: move each week on 364 days, correct the sold-out week, apply the growth, subtract the stock held and on order that will be left when the peak starts, and count the lead time back. One gift set takes minutes; many SKUs take longer.
When is a spreadsheet enough?
A spreadsheet is enough for a small brand that sells a handful of gift sets or hero products, keeps stock in one place and can look up last year’s three peak weeks in a few minutes, because the arithmetic in this piece is a handful of additions and one subtraction. A brand that sized last year’s peak in a sheet has the method.
What changes is the checking: many SKUs with their own peak weeks and suppliers, sell-outs to correct one by one, open orders to count as incoming, and drafts to raise per supplier. That is where Forecasting with Seasonal and Plan purchases saves time, on Business and Scale (see pricing). Units that come back after the weekend are not stock for the peak; our piece on restocking holiday returns covers them.
Frequently asked questions
How much stock should I order for Black Friday?
Cover what the product sold in the same peak weeks last year, plus your growth assumption, minus the stock on hand and on order still left when the peak starts. In our example a gift set sold 290 units over three peak weeks and needs 396 after a sell-out correction and 20% growth, against 170, so 226 are short.
Why not size the order from an average week?
An average week hides the peak. In our example a gift set sells about 15 units in an ordinary week, so three weeks use 45 and the 170 units left going into the peak look like plenty. Last year the same three peak weeks sold 290, about six times as much.
What if my product sold out last Black Friday?
The units it sold are what you had, not what customers wanted. Estimate the lost days by hand, about 40 units in our example, and add them. In Qoblex, Exclude stockout days has no effect on Seasonal variants, so the correction is manual; the variant’s chart shades Historical stockout periods.
What if the product did not exist last year?
On the Seasonal method, Qoblex marks a period Insufficient history when the matching week a year earlier falls before the variant’s first ever sale, and forecasts it as zero. Use Historical Average or Trend for that variant, or size its peak weeks by hand from a similar product that sold last November.
How do I forecast Black Friday demand in Qoblex?
Set the variant’s Forecast method to Seasonal on the variant itself, then open Forecasting V2; Seasonal copies what it sold in the matching week 364 days earlier. The forecast is statistical, built from your own sales. Forecasting is on the Business and Scale plans (see pricing). On Starter, work it out by hand from the Stock Movement report.
Does Qoblex create the purchase order for me?
Qoblex proposes a receipt for each variant projected to run short: the shortfall plus Coverage weeks of forecast demand, editable per line. Review purchases groups the orders by supplier and needs a receiving location for each. Orders are created as Draft with no prices, and a draft counts as incoming only once approved.
What if the order date has already passed?
In our example a 6-week supplier gives Monday 19 October, already past on 4 November, while a 2-week supplier gives Monday 16 November. Source the shortfall faster where you can, or size the promotion to stock on hand and on order, and run the sum in early October next year.