



After Black Friday, record six numbers for each hero SKU while they are easy to collect: sell-through, days out of stock, units oversold, returns, margin after discount, and landed cost against selling price. Qoblex’s Inventory Turnover, Stock Movement, Products and Stock on Hand reports supply the figures behind five of them; units oversold come from your own records. Each number sets a quantity or a price in next year’s order.
Many small brands open the January books with a revenue figure and a memory that their best seller ran out some time over the weekend, but not which day, and not how many orders they had already taken. That is fair when the weekend left no time for notes, and it is why the recap is written the week after.
Why is the Monday after Cyber Monday the day to record Black Friday numbers?
The Monday after Cyber Monday, 7 December 2026, is the day for a small brand to record its Black Friday stock numbers, because the weekend is still fresh, the first returns have started, and the stock figures have not yet been mixed with December deliveries and January sales. Orders taken after a SKU hit zero live only in the order notes and someone’s memory.
Returns are not final on 7 December, so the sheet gets a second pass in early January, each read dated. The Black Friday inventory checklist sets the sheet up beforehand, and running the Black Friday weekend day by day covers what to jot down during it. Ad spend and conversion belong to the marketing review, and market totals like our Black Friday and Cyber Monday statistics say nothing about one brand’s own shelf.
What goes on a one-page Black Friday recap sheet?
A one-page Black Friday recap sheet for a small brand has six lines for each hero SKU: sell-through, days out of stock, units oversold, returns, margin after discount, and landed cost against selling price, each with the place it comes from and the decision it feeds. Hero SKUs are the lines that carried the weekend, usually the top five by Sold Quantity in the Products report grouped by Product.
| Recap line | What to record | Where it comes from | Why it matters for next year's order |
|---|---|---|---|
| Sell-through by hero SKU | Opening Balance, In Quantity, Out Quantity, Sell-Through for the weekend dates | Qoblex: Reporting, Inventory, Inventory Turnover (Sell-Through = Out Quantity divided by In Quantity plus Opening Balance) | Shows how much of what you had really moved, so next year's order starts from what sold, not from what you stocked |
| Days out of stock | The date Closing Balance reached 0 and the date of the next receipt; the days between | Qoblex: Stock Movement (Closing Balance by date, Received Quantity); on Business and Scale the forecast chart's Historical stockout periods layer. Counted by you | A sold-out week records what you had, not what customers wanted |
| Units oversold | Units taken after the SKU had no stock (your own figure, not a Qoblex one) | Your own order notes or customer-service log. Qoblex has no column for it; the Sales list can be filtered by Stock Status Awaiting Stock while those orders are still waiting | Unmet demand to add back to next year's number |
| Returns by SKU | Return Quantity per SKU, with the date you read it | Qoblex: Stock Movement (Return Quantity); the Products report (Returned Quantity) | Sales net of returns are the demand you can plan on; the first read is incomplete |
| Margin after discount | Gross Sales, Discounts, Net Sales, COGS, Margin, Margin Percentage | Qoblex: Reporting, Sales, Products (Margin is Net Sales minus COGS; Net Sales also nets cancellations and refunds) | Shows how deep next year's offer can go before the unit stops paying |
| Landed cost against selling price | Moving Average Cost, Retail Price, average selling price after discount | Qoblex: Stock on Hand (Moving Average Cost includes landed costs added as the Landed Costs type); average selling price is Net Sales divided by Sold Quantity (your division) | Sets the lowest price worth accepting and the discount ceiling |
Six lines for five SKUs is thirty cells, which fits on one page. Sell-through is only as good as its Opening Balance, so a brand that counted its fast movers before the weekend starts from a figure it trusts. Two of the six lines the brand counts itself.
Which recap lines does Qoblex give you, and which come from your own records?
Qoblex’s Inventory Turnover report gives a small brand its sell-through for each SKU as Out Quantity divided by In Quantity plus Opening Balance for the dates chosen, and its Stock Movement report adds the Return Quantity and the dates a Closing Balance reached zero, so half of a Black Friday recap sheet comes from two Qoblex reports. Inventory Turnover opens on the last year and builds its figures from stock movements in the period, so the stock person sets the dates to the weekend. A SKU that shipped 340 of 400 works out at 340 divided by 400, or 85%. A SKU that sells out reads 100% whether it ran out on Friday or Monday, which is why the next two lines exist.
There is no days-out-of-stock column. In Stock Movement the stock person counts the days between the Closing Balance reaching 0 and the next Received Quantity. On Business and Scale, a variant’s forecast chart also shades Historical stockout periods behind its sales (see pricing).
Units oversold have no report column, so the record is the brand’s own order notes or customer-service log. The Sales list filtered by Stock Status to Awaiting Stock shows orders that still need stock allocated, but arriving stock is allocated to them oldest first, so count the list while it is true. A product that allows selling when sold out shows Ready To Ship instead, so the shortage is hidden rather than shown.
Stock Movement also carries Return Quantity (customer returns), and the Products report Returned Quantity. The 7 December figure is a first read: Adobe Analytics, counting US online sales over the 2025 holiday season, reported that “1 out of every 7 returns this season happened during this time period”, meaning 26 to 31 December. Whether a return goes back on the shelf belongs to getting holiday returns back into stock.
The Products report carries Gross Sales, Discounts (as a negative amount), Net Sales, COGS, Margin and Margin Percentage, with Margin as Net Sales minus COGS. Net Sales also takes off cancellations and refunds, so a refund posted after 7 December lowers Margin. The summary row shows Margin Percentage as 0, so read it from rows grouped by Product.
Stock on Hand shows Moving Average Cost, Retail Price and Total Cost for each variant. Freight and duty entered on the purchase order as Landed Costs before receiving are spread across its lines by value and join the Moving Average Cost on receipt; an Expenses line does not. The average selling price is the brand’s own division, Net Sales over Sold Quantity.
On Business and Scale, Save Report keeps a view’s filters, grouping, sorting and visible columns, but reruns against current data, so it will not hold Monday’s figures. Export Report emails a CSV download link, without hidden columns. The figures live on the sheet; Qoblex’s inventory reports are where they come from.
What does a supplement brand’s recap look like for three SKUs?
A supplement brand’s recap for three SKUs on Monday 7 December shows that the SKU reading 100% sell-through was out of stock for 3 days, that the SKU reading 30% sold at a 40% discount and leaves 2.40 a box, and that the hero SKU kept 8.60 a unit after a 25% discount.
Let’s assume a supplement brand with one online store sits down on Monday 7 December with three SKUs: magnesium capsules (60 count), a greens powder (300 g) and a box of protein bars (12 count). Its reports run from Monday 23 to Monday 30 November 2026. It started with 400 magnesium, 250 greens and 300 bars, received 200 more bars on 24 November, and shipped 340, 250 and 150, the units the sales figures cover. Magnesium sold at 20.00 less 25% (15.00), greens at 30.00 less 20% (24.00) and bars at 24.00 less 40% (14.40). Each SKU came in on its own purchase order with freight and duty as Landed Costs, so its Moving Average Cost, and the COGS recorded a unit, are 6.40, 12.50 and 12.00.
The greens powder shipped its last unit on Saturday 28 November and was next received on Wednesday 2 December, so it was out of stock for 3 days: Sunday 29 November, Monday 30 November and Tuesday 1 December. Return Quantity for 1 to 7 December reads 17, 9 and 6.
| Line | Magnesium capsules (60) | Greens powder (300 g) | Protein bars (box of 12) |
|---|---|---|---|
| Opening Balance | 400 | 250 | 300 |
| In Quantity | 0 | 0 | 200 |
| Out Quantity | 340 | 250 | 150 |
| Sell-through | 85% | 100% | 30% |
| Closing Balance | 60 | 0 | 350 |
| Days out of stock | 0 | 3 | 0 |
| Units oversold | 0 | 0 | 0 |
| Returns, 1 to 7 December | 17 | 9 | 6 |
| Returns against units shipped | 5.0% | 3.6% | 4.0% |
| Gross Sales | 6,800.00 | 7,500.00 | 3,600.00 |
| Discounts | −1,700.00 | −1,500.00 | −1,440.00 |
| Net Sales (before refunds) | 5,100.00 | 6,000.00 | 2,160.00 |
| COGS | 2,176.00 | 3,125.00 | 1,800.00 |
| Margin after discount | 2,924.00 | 2,875.00 | 360.00 |
| Margin Percentage | 57.3% | 47.9% | 16.7% |
| Landed cost a unit | 6.40 | 12.50 | 12.00 |
| Average selling price after discount | 15.00 | 24.00 | 14.40 |
| Left a unit | 8.60 | 11.50 | 2.40 |
The greens powder reads 100%, but demand was at least the 250 units shipped and likely higher, because shoppers who found it sold out over those three days left no order to count. The protein bars read the other way: 150 of 500 moved at 40% off, each box leaving 2.40, so next year’s order starts from the 150 that moved, not the 500 on the shelf. The 350 left belong to deciding whether to clear, bundle or write off slow stock.
The magnesium is the line that carried the weekend. The example is before refunds, so each Margin figure falls as refunds post, and returns stay a first read until January.
What do you do at the screen on the Monday after Cyber Monday?
A small brand fills in the recap sheet on the Monday after Cyber Monday in eight steps: set the Inventory Turnover dates, note sell-through, read Stock Movement for the days out of stock and the returns, read the Products report for margin, read Stock on Hand for cost, add the units oversold from its own records, and keep the sheet.
- Open Reporting, Inventory, Inventory Turnover and set the dates from the day before the first offer to the end of Cyber Monday.
- Write down Opening Balance, In Quantity, Out Quantity and Sell-Through for each hero SKU.
- Open Stock Movement from the same start date to today and count the days from each Closing Balance of 0 to the next Received Quantity.
- Set Stock Movement to the days since the weekend and write down Return Quantity.
- Open Reporting, Sales, Products for the same dates, group by Product, and write down Gross Sales, Discounts, Net Sales, COGS and Margin.
- Open Stock on Hand and write down Moving Average Cost and Retail Price.
- Add units oversold from your own records, and divide Net Sales by Sold Quantity for the average selling price.
- Save each view as a report on Business or Scale, or export it to CSV, and date the sheet for a returns pass in early January.
Steps 3 and 7 are the only ones where the stock person counts rather than copies, and they matter most next year.
How does each recap line change next year’s order?
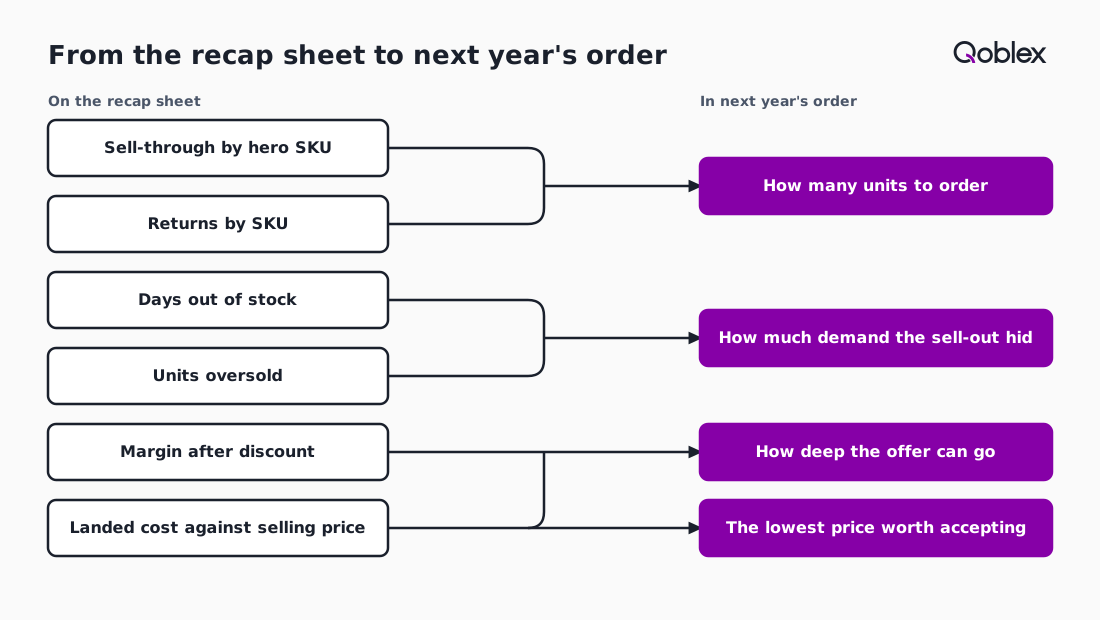
Each line on the recap sheet sets one decision in next year’s order: sell-through and returns set how many units to order, days out of stock and units oversold set how much demand the sell-out hid, margin after discount sets how deep the offer can go, and landed cost sets the lowest price worth accepting.
The sold-out lines matter most to a brand that forecasts. Qoblex’s Seasonal forecast method looks back to the matching week one year earlier, 364 days so the weekday alignment holds, and uses what the variant sold that week, so Black Friday 2027, on Friday 26 November, reads the week of Friday 27 November 2026. Seasonal copies a sold-out week as it stands, and Exclude stockout days has no effect on Seasonal variants, so the buyer adds the missed units by hand, from this sheet.
The forecast is statistical, built from the brand’s own sales, on the Business and Scale plans; on Starter or a spreadsheet the correction is made by hand, as forecasting Black Friday stock from last year explains. The bars’ leftover stock is a question for clearing slow stock in January, the depth of the offer for what small brands learned from Black Friday 2024 and 2025, and landed cost sits beside the last order date from supplier lead times.
When is a spreadsheet and your own sales export enough?
A brand with a handful of SKUs, one store and its costs already in a spreadsheet can fill in this recap sheet from its own sales export and cost list, and a system such as Qoblex earns its place when the stock, the costs and the orders have to agree across many SKUs or more than one store. The sheet works the same way by hand, because the six lines are the point, not the tool.
What a system adds is that sell-through, Closing Balance dates, returns and cost come out of one record instead of three exports that someone lines up by SKU and date. That starts to matter once lining them up takes longer than reading them.
Frequently asked questions
Which stock numbers should I record after Black Friday?
Record six numbers for each hero SKU: sell-through, days out of stock, units oversold, returns, margin after discount, and landed cost against selling price. Read them on the Monday after Cyber Monday, 7 December 2026, and check returns again in early January.
How do I calculate sell-through in Qoblex?
Open Reporting, Inventory, Inventory Turnover and set the dates to the weekend. Sell-Through is Out Quantity divided by In Quantity plus Opening Balance, or 0 when that sum is 0. A SKU that shipped 150 of 500 available works out at 30%.
Does Qoblex show how many units I oversold?
No report column gives units oversold; use your own order notes or customer-service log. While those orders wait, the Sales list can be filtered by Stock Status, Awaiting Stock. A product that allows selling when sold out shows its orders as Ready To Ship instead, which hides the shortage.
How do I count the days a SKU was out of stock?
Open Stock Movement from the start of the weekend to today, note the date the Closing Balance reached 0 and the date of the next Received Quantity, and count the days between. On Business and Scale, the forecast chart also shades Historical stockout periods behind the variant’s sales.
When should I record Black Friday returns?
Read Return Quantity in Stock Movement on the Monday after Cyber Monday for a first figure, and write the date beside it. Read it again in early January, because returns keep arriving through December, and update the sheet with the second figure.
Can I save or export the recap in Qoblex?
On Business and Scale, Save Report keeps a view’s filters, grouping, sorting and visible columns, but reruns against current data, so it is not a snapshot. Export Report produces a CSV emailed as a download link, without hidden columns. Write Monday’s figures on the sheet itself.